Manish Goel

Manish Goel - SEBI Registered Research Analyst

About Manish Goel

SEBI Registered Research Analyst • Chartered Accountant

377 Articles Published

Manish Goel is a Chartered Accountant, SEBI Registered Research Analyst, and founder of Manish Goel PMS. A full-time value investor since 2010, he has helped thousands of investors build long-term wealth through quality stock picking and disciplined fundamental analysis.

June 4, 2026
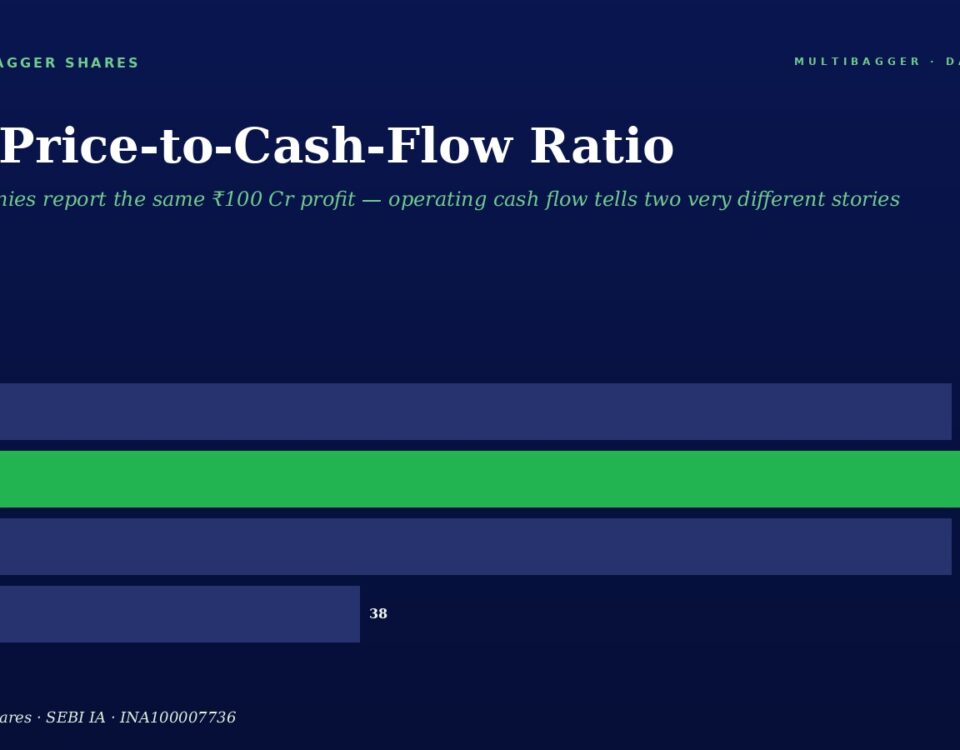
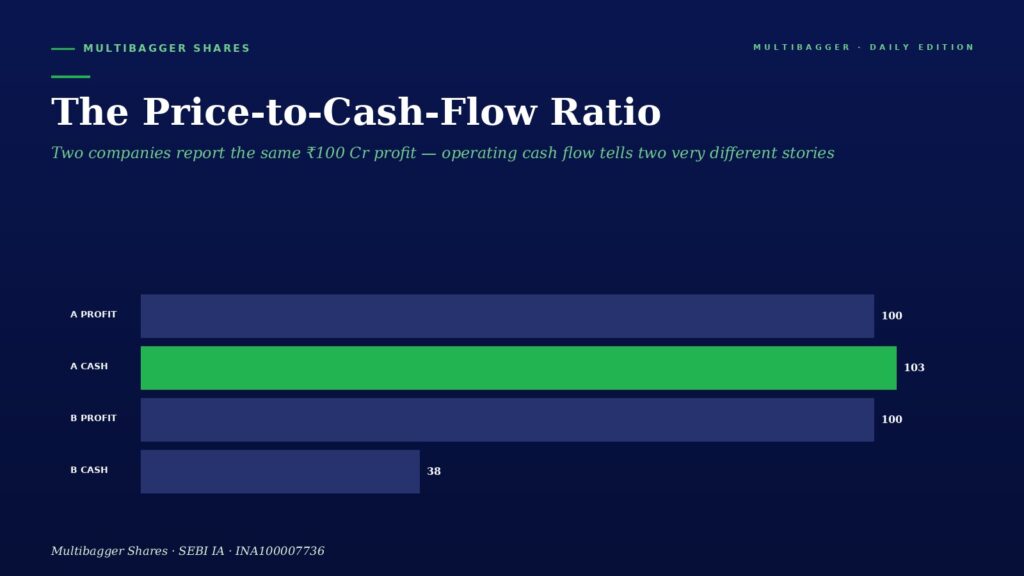
Bar chart on a dark blue background comparing two companies: A profit 100 and cash 103; B profit 100 and cash 38 (blue profit bars, green cash bar).

Price-to-Operating-Cash-Flow (P/CFO) Ratio: The Valuation Multiple That Refuses to Trust Profits Until the Cash Arrives

MGMANISH GOEL PMS☰ HomePast PerformanceServicesMedia & PressBlogsAwards WhatsApp · 7380122211 VALUE INVESTING · BLOG Price-to-Operating-Cash-Flow (P/CFO) Ratio: The Valuation Multiple That Refuses to Trust Profits Until […]
June 3, 2026
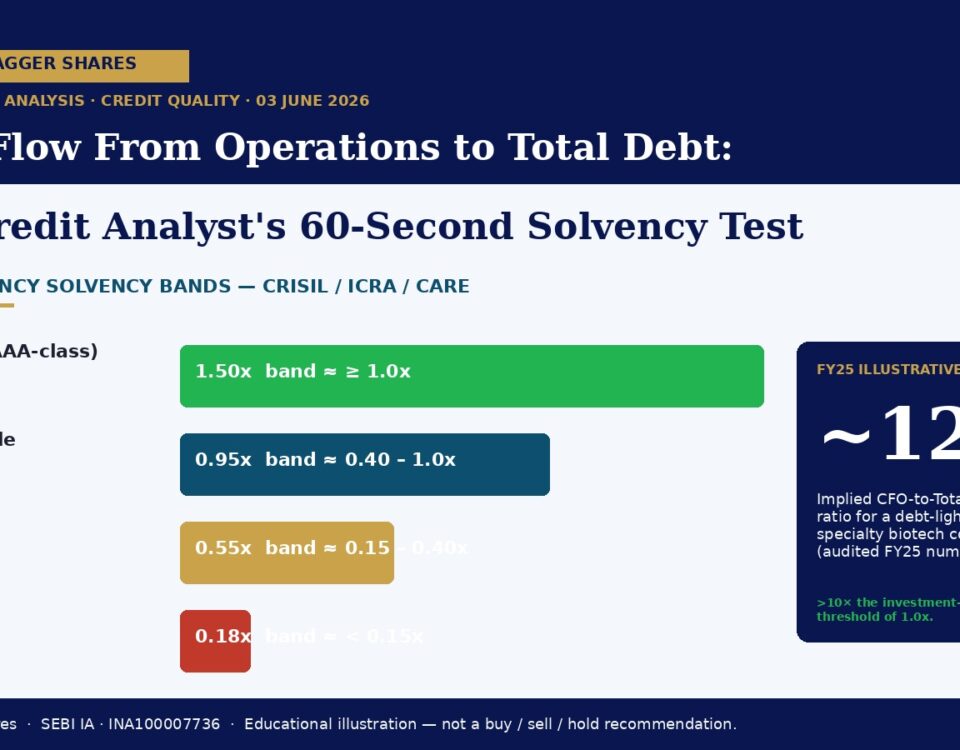
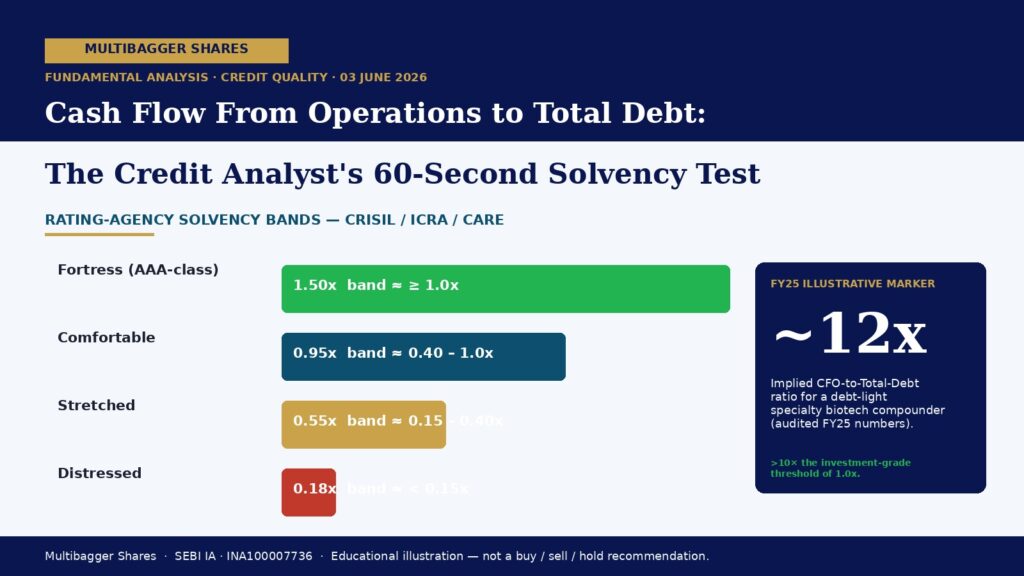
Infographic showing debt/FCF multipliers by category: Fortress 1.50x, Comfortable 0.95x, Stretched 0.55x, Distressed 0.18x and a FY25 marker around 12x for CFO-to-debt.

Cash Flow From Operations to Total Debt Ratio: The Credit-Analyst’s 60-Second Solvency Test That Separates Self-Liquidating Balance Sheets From Slow-Bleed Leverage Time Bombs

The Cash Flow From Operations to Total Debt ratio — CFO divided by Total Borrowings — is the single most under-appreciated solvency test in Indian fundamental analysis. This article walks through the formula, two contrasting cases, and a dedicated FY25 audited case study.
June 2, 2026
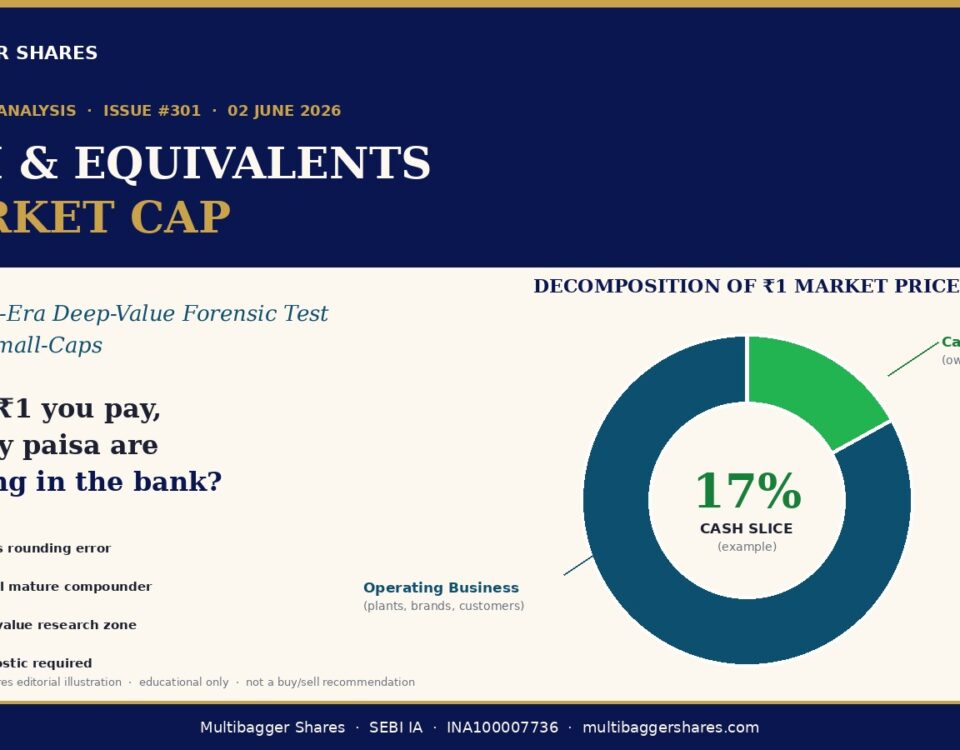
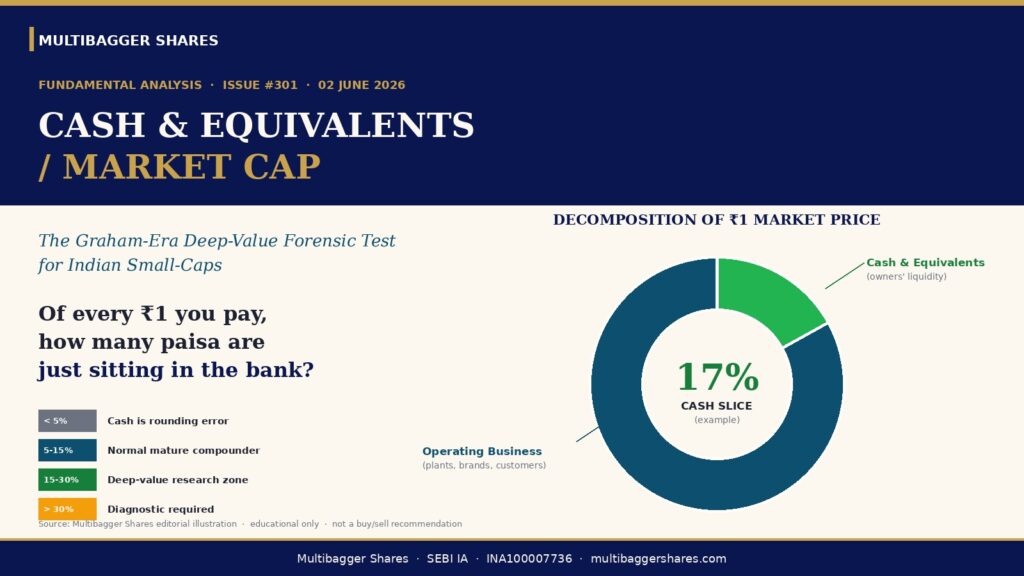
Cover page of Manish Goel Portfolio Management Service issue #301: Cash & Equivalents / Market Cap with a circular donut chart showing 17% cash slice and legends for liquidity and operating business accessors.

Cash & Equivalents as a Percentage of Market Cap: The Graham-Era Deep-Value Forensic Test That Reveals How Much You’re Actually Paying for the Operating Business

The Graham-era forensic test that asks: of every rupee you pay for a share, how many paisa are simply cash sitting in the company's bank account? An educational illustration using Titan Biotech FY25 audited numbers as a positive case study.
June 1, 2026
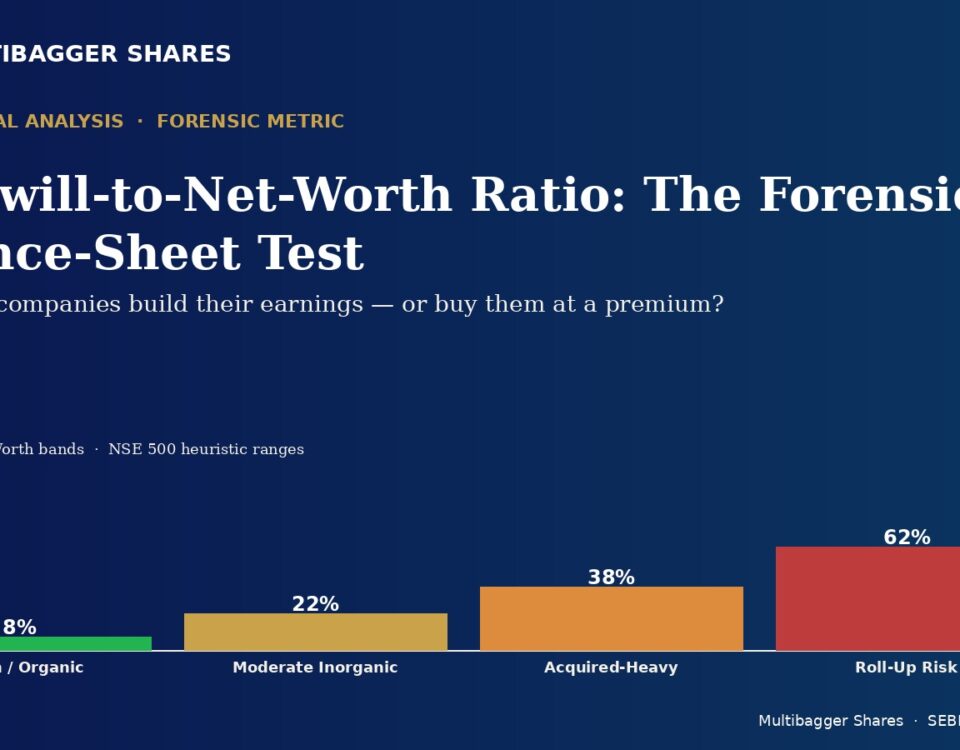
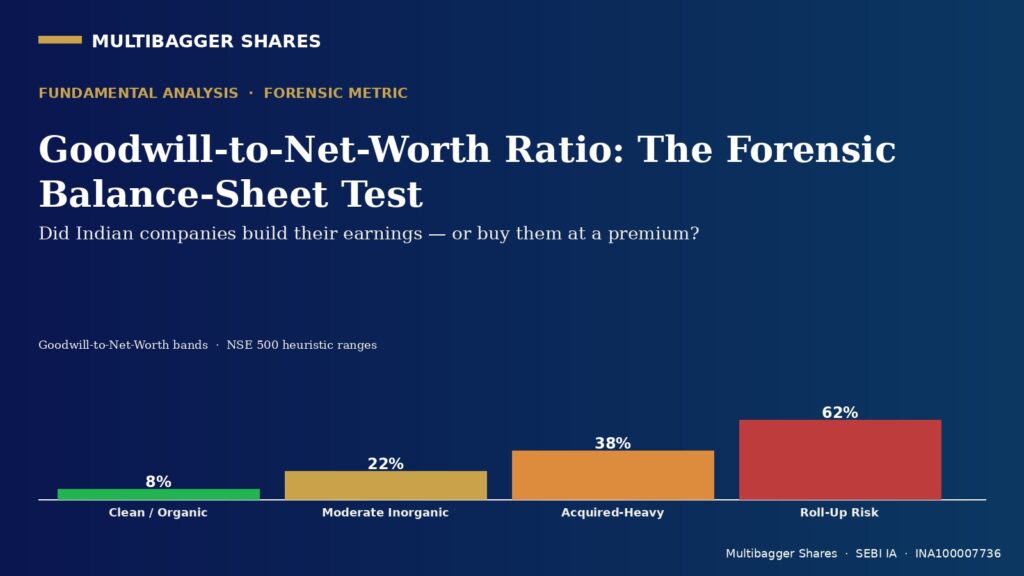
Title and subtitle of a metrics graphic: Goodwill-to-Net-Worth Ratio: The Forensic Balance-Sheet Test; 'Did Indian companies build earnings or buy them at a premium?' with a four-bar chart: Clean/Organic 8%, Moderate Inorganic 22%, Acquired-Heavy 38%, Roll-Up Risk 62% on a dark blue gradient background.

Goodwill-to-Net-Worth Ratio: The Forensic Balance-Sheet Test That Reveals Whether Indian Companies Bought Their Earnings Or Built Them Organically

How one balance-sheet line — Goodwill on Consolidation — reveals whether Indian companies grew their earnings organically or simply purchased them at a premium. A forensic FY25 walkthrough with an organically-built reference set, including Ind AS 36 impairment-test signals and four common traps.
+91-7380122211