
Manish Goel

About Manish Goel
SEBI Registered Research Analyst • Chartered Accountant
377 Articles Published
Manish Goel is a Chartered Accountant, SEBI Registered Research Analyst, and founder of Manish Goel PMS. A full-time value investor since 2010, he has helped thousands of investors build long-term wealth through quality stock picking and disciplined fundamental analysis.
April 29, 2026
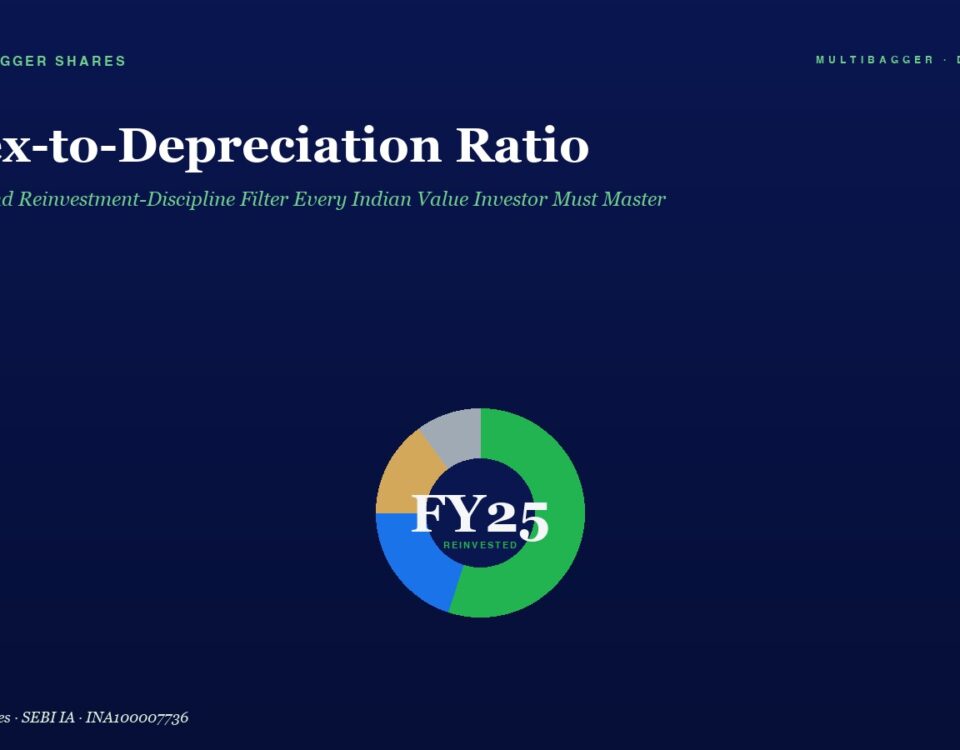
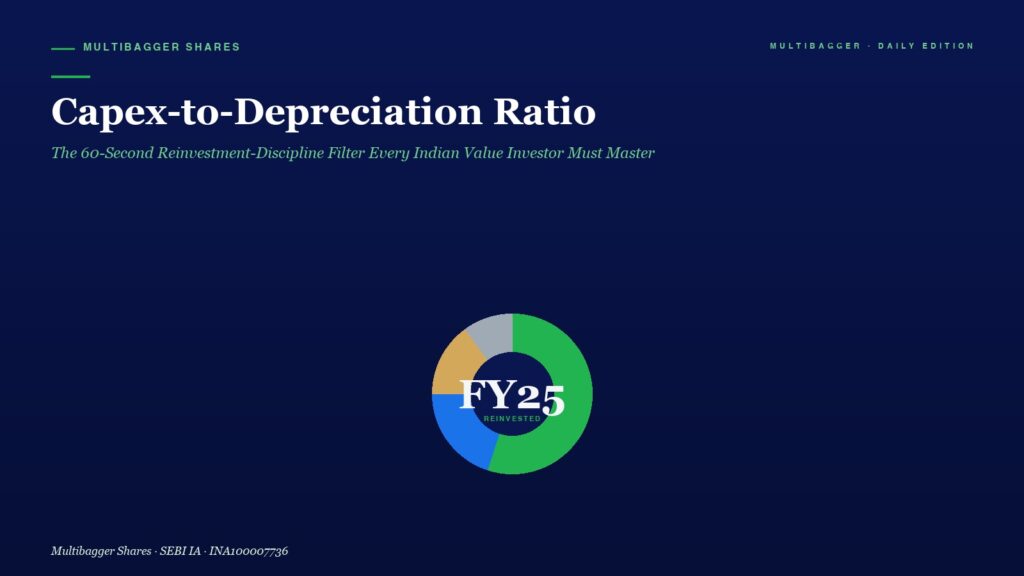
The Capex-to-Depreciation Ratio is the cleanest 60-second filter for whether a business is genuinely reinvesting (above 1.0x) or quietly harvesting (below 1.0x). Titan Biotech FY25 audited numbers — ~Rs.11 Cr CWIP, ~Rs.57 Cr gross block, ~7% depreciation/gross block, ~103% CFO/Operating Profit and only ~Rs.3 Cr total borrowings — illustrate disciplined, internally funded reinvestment. Educational illustration; not a buy/sell recommendation.
April 29, 2026
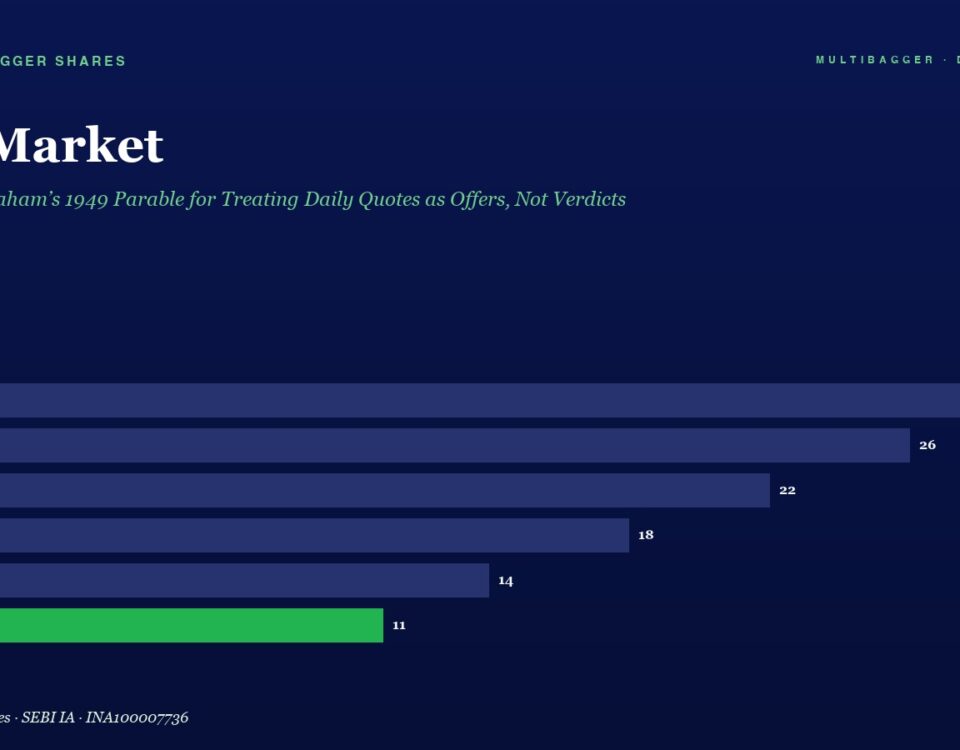
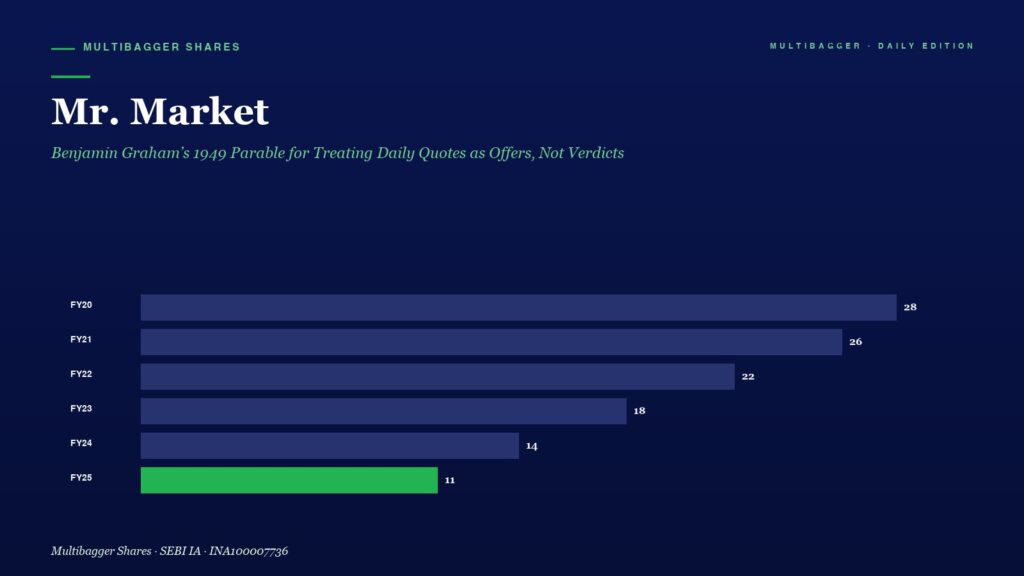
Benjamin Graham's 1949 Mr. Market parable is the operating system for ignoring daily price quotes. Titan Biotech FY25's audited quiet — ₹3 cr borrowings, 103% CFO/PAT, 36.4% ROCE — illustrates the underlying factory that survives every tick.
April 28, 2026
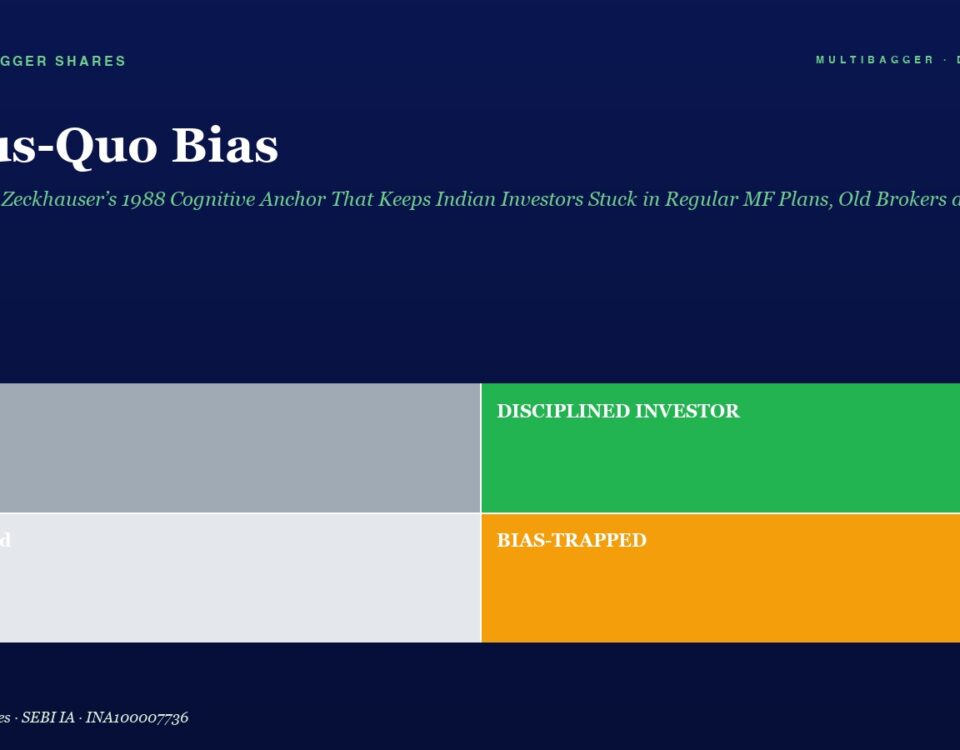
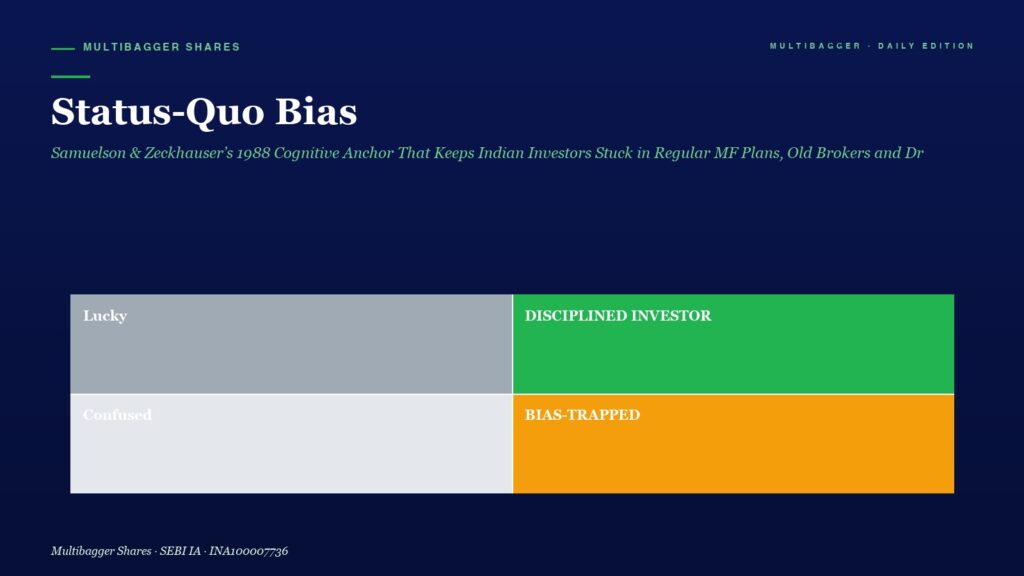
Samuelson & Zeckhauser (1988) showed that decision-makers stick to existing options far more than rationality justifies. AMFI / SEBI data shows roughly half of equity MF AUM is still in Regular Plans 13+ years after Direct Plans launched. This post unpacks the bias, gives a structural fix, and uses Titan Biotech FY25's audited numbers to illustrate corporate anti-status-quo discipline. Educational case study only — not investment advice.
April 28, 2026
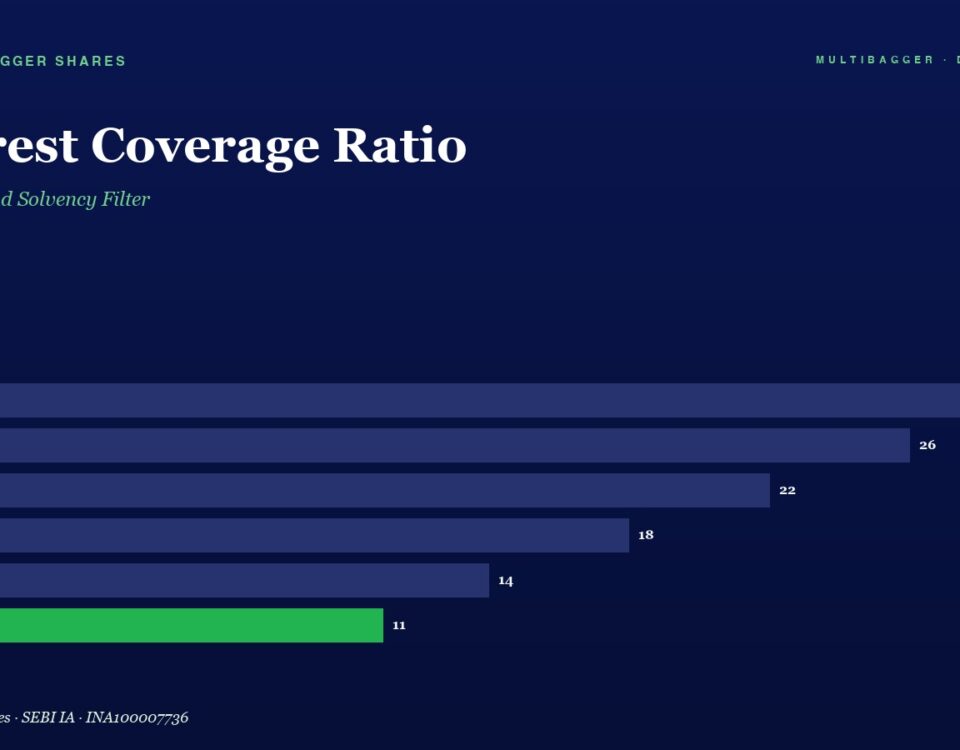
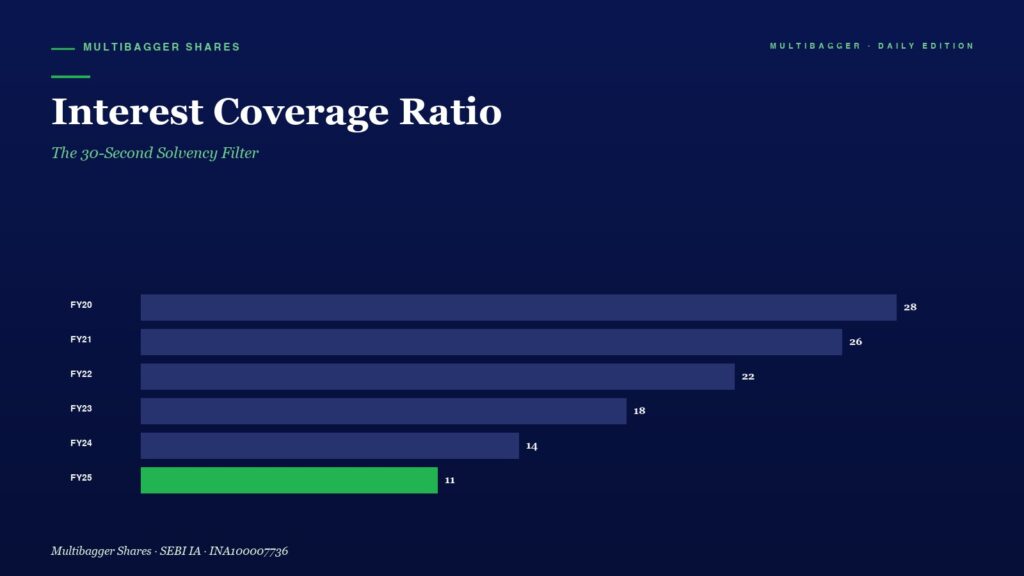
Interest Coverage Ratio (EBIT/Finance Costs) is the 30-second solvency filter every Indian value investor must know. Titan Biotech FY25's ~₹3 Cr borrowings, ₹11 Cr internally funded CWIP, and 103% CFO/Operating Profit illustrate what fortress-coverage looks like in numbers.