
Manish Goel

About Manish Goel
SEBI Registered Research Analyst • Chartered Accountant
377 Articles Published
Manish Goel is a Chartered Accountant, SEBI Registered Research Analyst, and founder of Manish Goel PMS. A full-time value investor since 2010, he has helped thousands of investors build long-term wealth through quality stock picking and disciplined fundamental analysis.
May 27, 2026
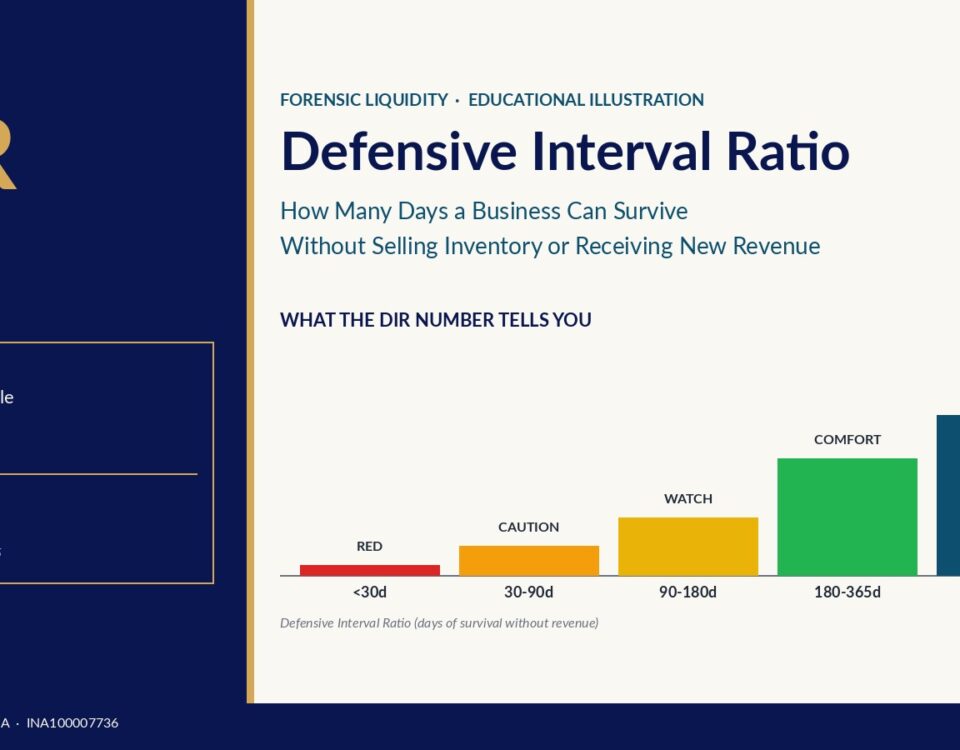
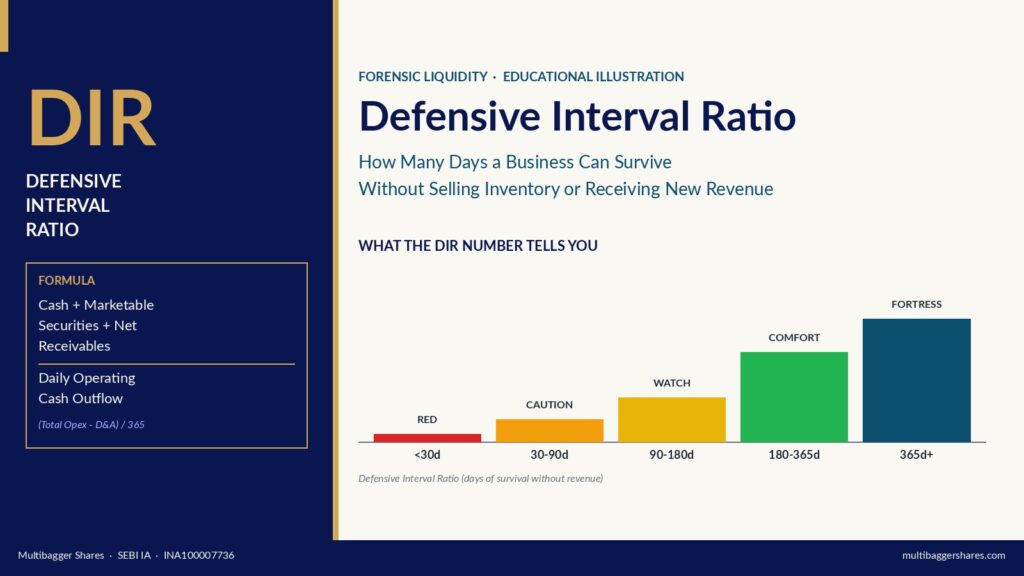
How to read the Defensive Interval Ratio — the forensic liquidity metric that counts days of survival without selling inventory or receiving new revenue, illustrated with audited FY25 markers from a disciplined Indian specialty-biotech operator.
May 26, 2026
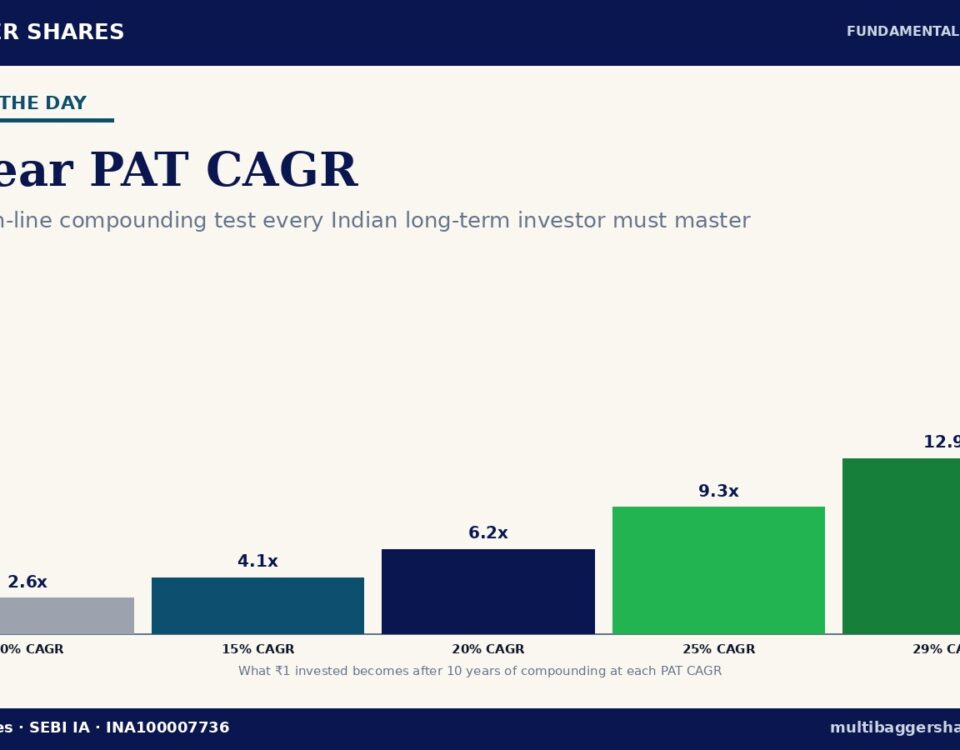
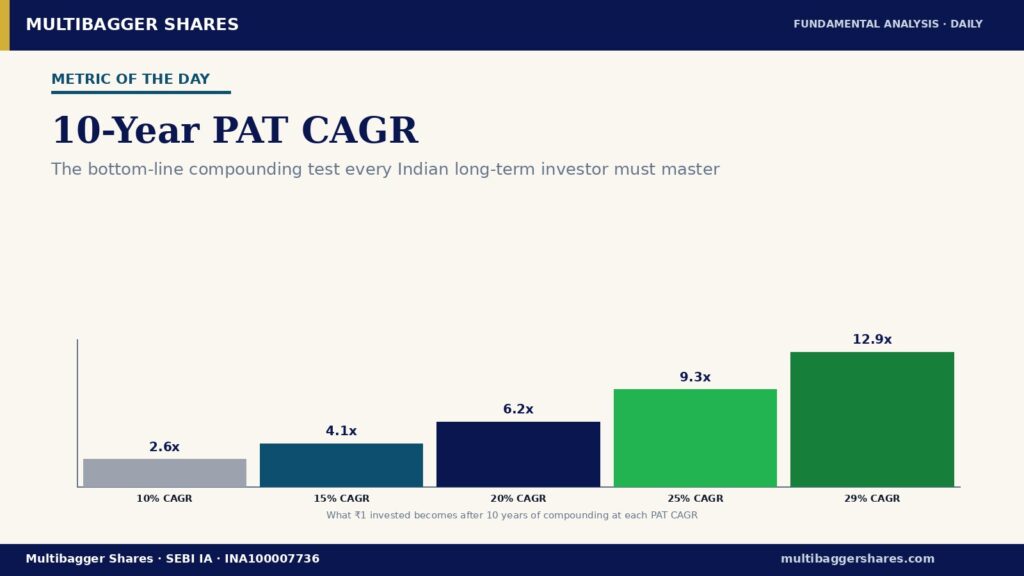
Learn how to read 10-Year PAT CAGR, the single most concentrated measure of a decade of bottom-line compounding — with Indian-context benchmarks, four diagnostic archetypes, six classic traps, and a worked illustration from Titan Biotech's FY25 audited disclosures.
May 25, 2026
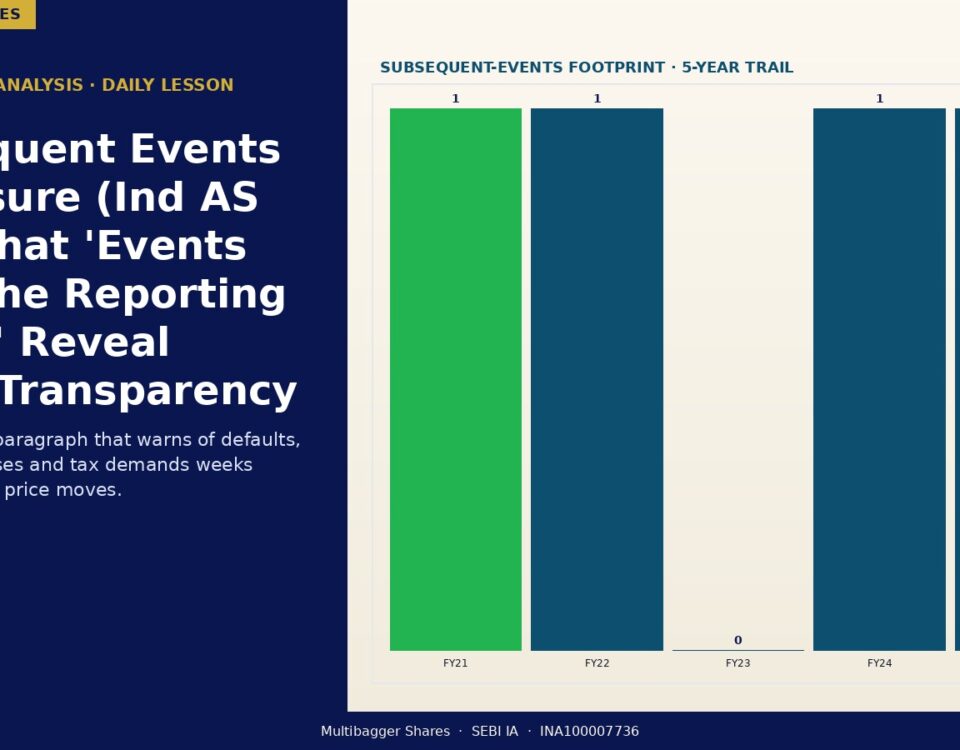
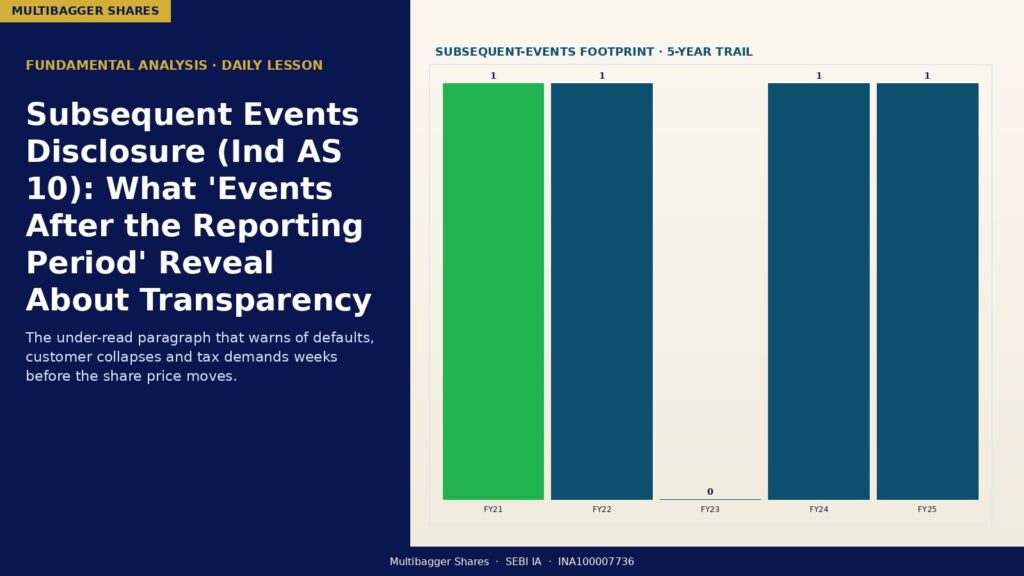
India's investing universe has grown to over 11 crore investors, but few know how to read the most under-appreciated paragraph in any audited annual report. Ind AS 10's 'Events After the Reporting Period' note can reveal a billion rupees of damage the headline numbers never show. Here is the 5-step framework, the two-category rule under SA 701, and an illustration of what disciplined disclosure looks like in practice.
May 24, 2026
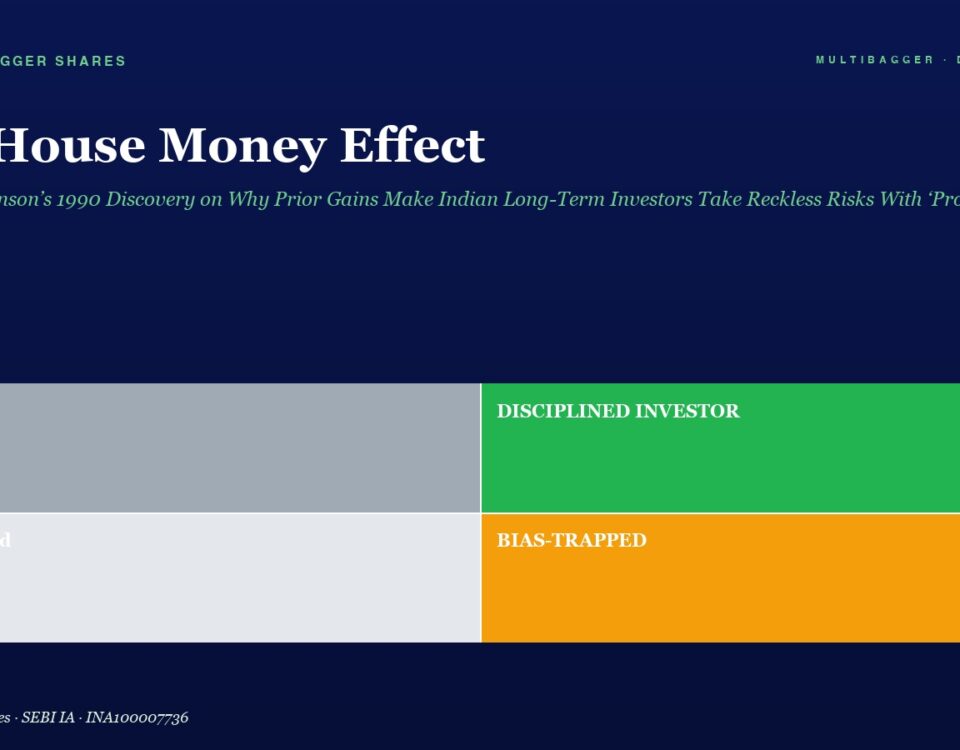
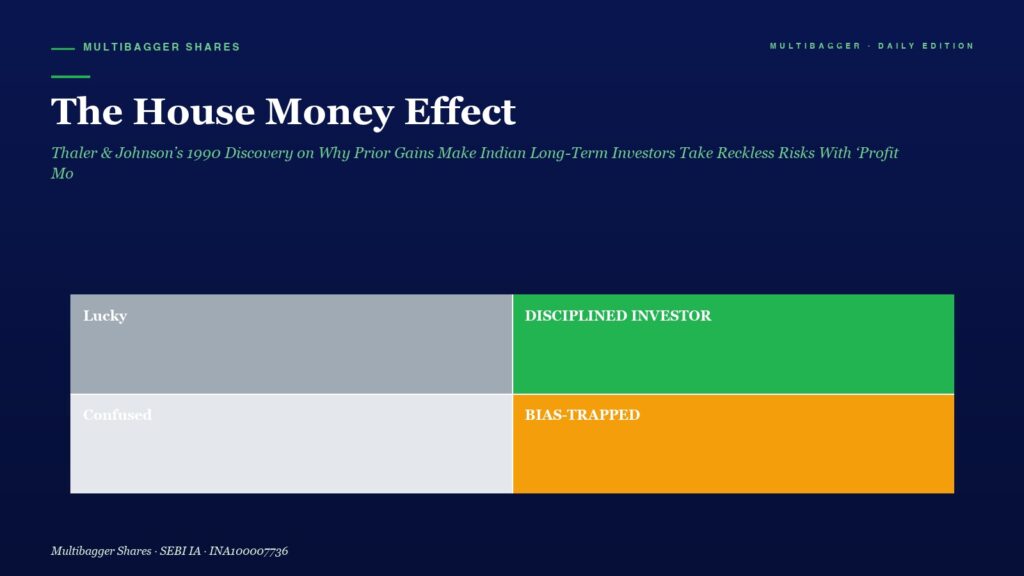
Thaler and Johnson 1990 documented the House Money Effect — investors take riskier bets with prior gains. Indian retail F&O data shows the pattern at population scale. The defence is procedural: weekly net-worth aggregation, pre-committed position caps, 30-day windfall quarantine, decision journaling.