
Manish Goel

About Manish Goel
SEBI Registered Research Analyst • Chartered Accountant
377 Articles Published
Manish Goel is a Chartered Accountant, SEBI Registered Research Analyst, and founder of Manish Goel PMS. A full-time value investor since 2010, he has helped thousands of investors build long-term wealth through quality stock picking and disciplined fundamental analysis.
April 17, 2026
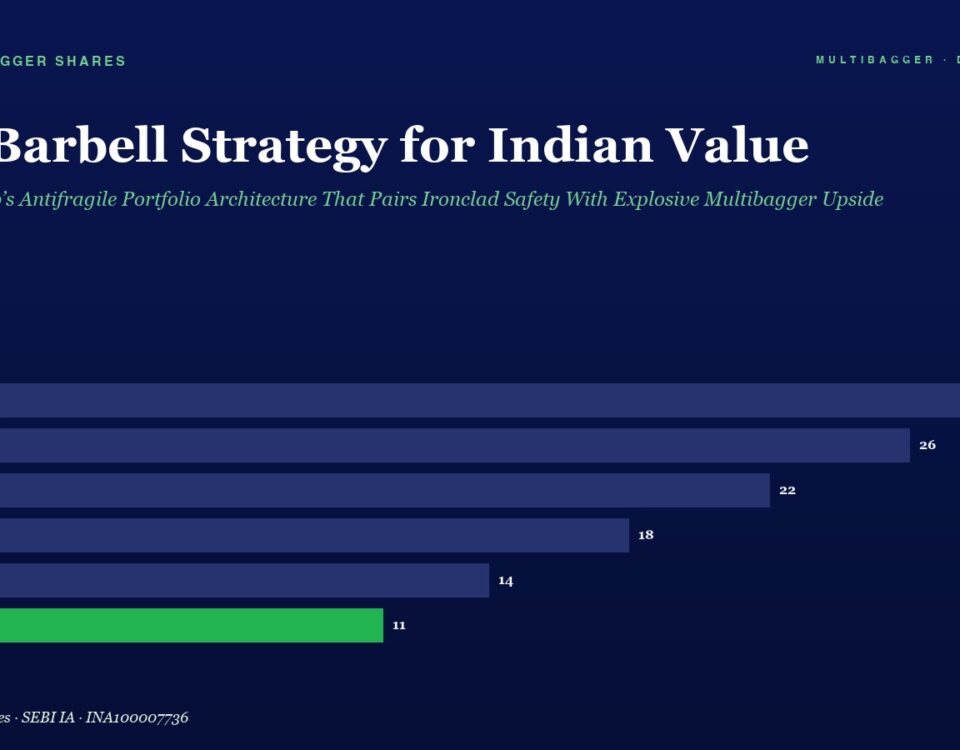
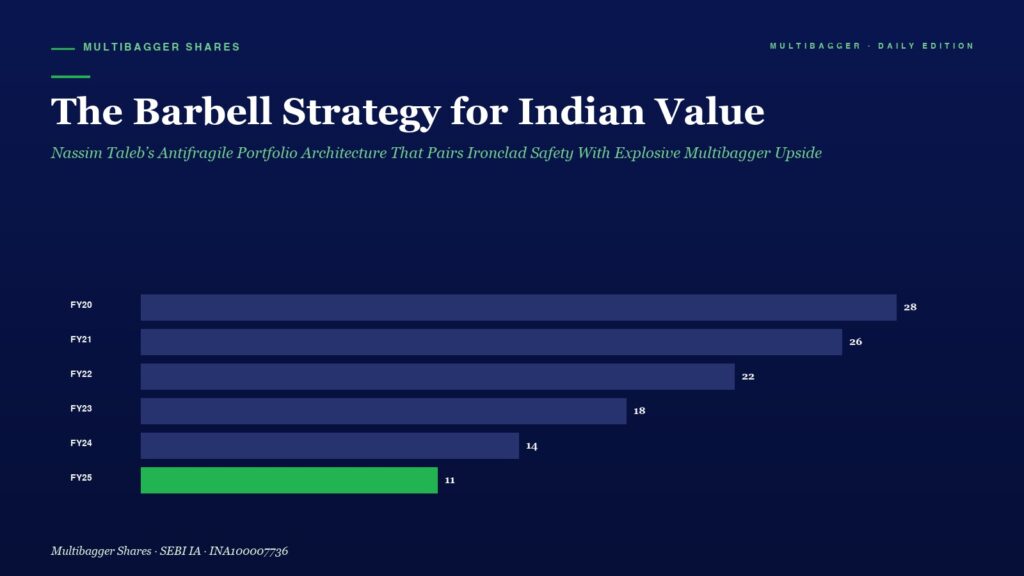
Nassim Taleb's barbell strategy teaches Indian value investors to combine 80-90% ultra-safe assets with 10-20% high-upside quality small-caps for a truly antifragile portfolio.
April 16, 2026
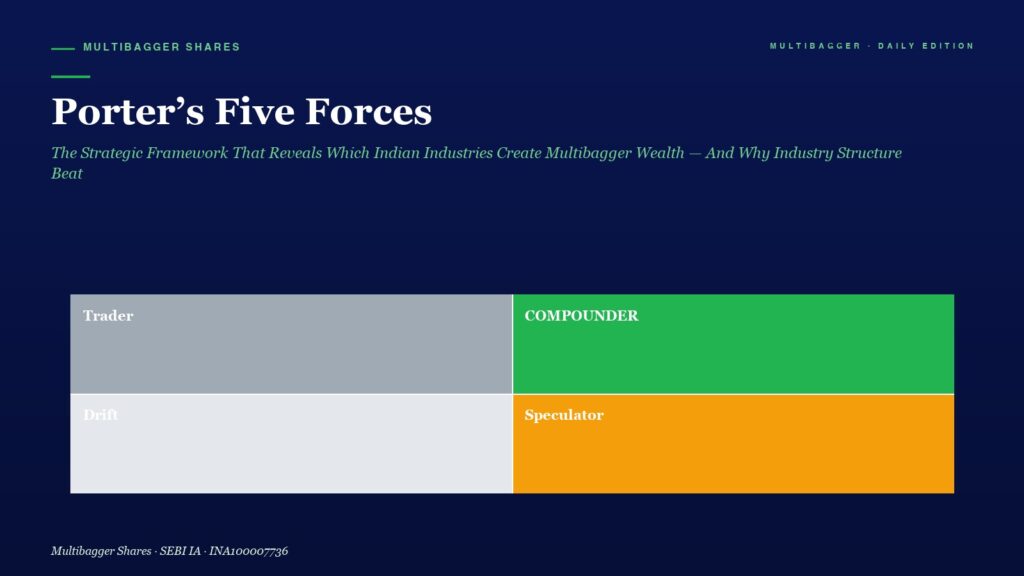
Michael Porter's Five Forces framework decodes industry structure before stock selection. Rivalry, entry barriers, supplier and buyer power, and substitutes determine whether industries create or destroy capital — the upstream reason moats like switching costs and pricing power even exist.
April 16, 2026
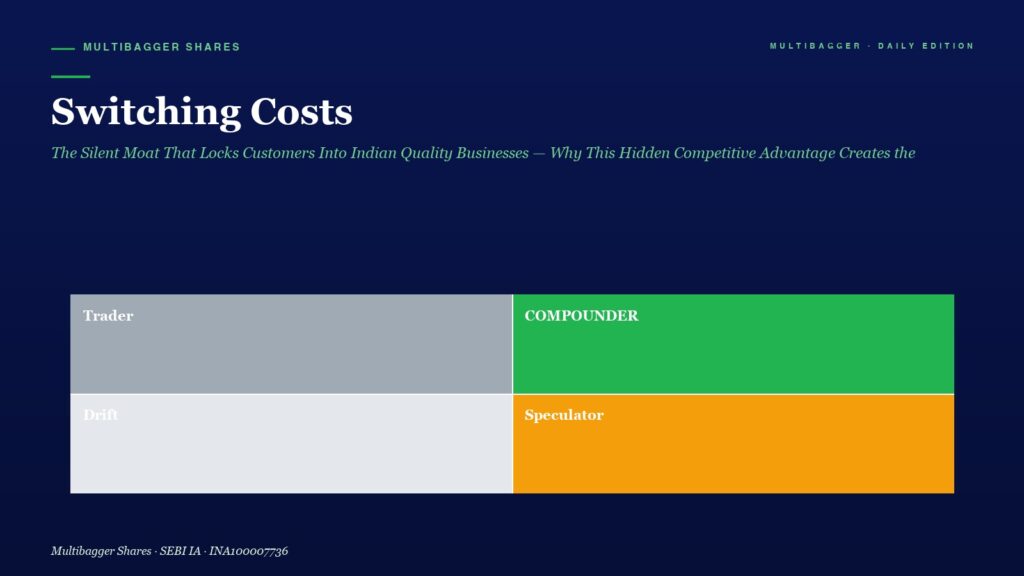
Switching costs are the silent, stubborn moat that locks Indian customers into quality suppliers — a regulatory, procedural, or behavioural friction that makes leaving a supplier more expensive than staying. Here is the complete 6-type framework, 5-signal checklist, and real-world Indian case files every value investor must master.
April 16, 2026
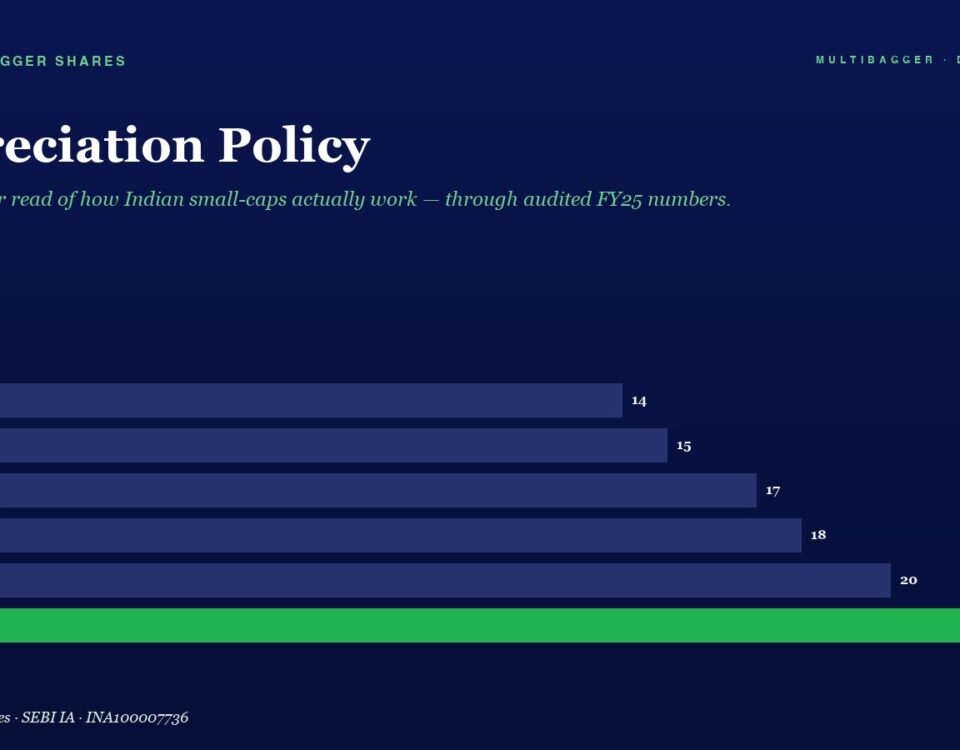
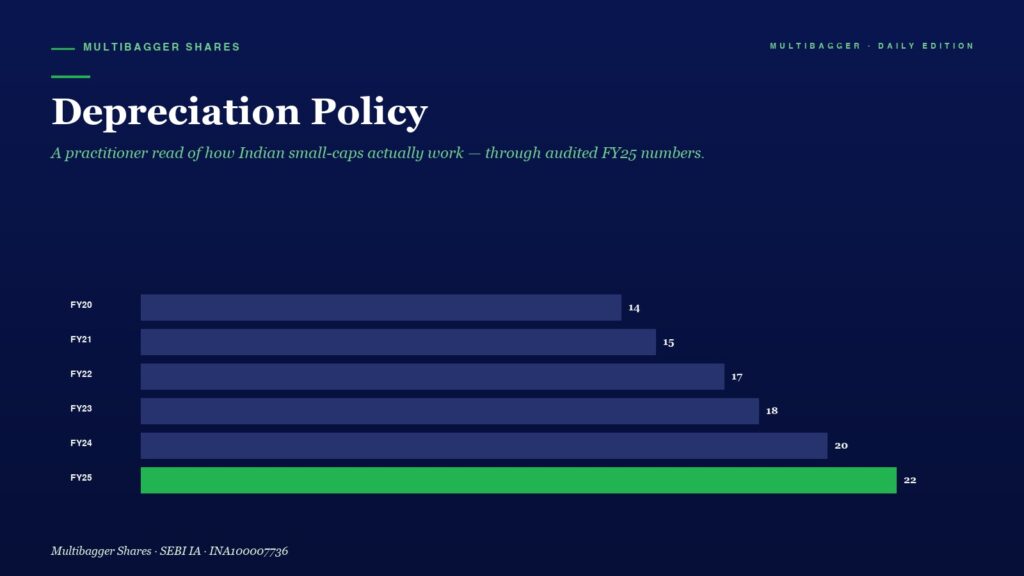
Deep-dive case study: Titan Biotech's decade-long depreciation-to-gross-block pattern reveals clean management accounting — the forensic test that separates real earnings from manipulated ones in Indian small-caps.