
Manish Goel

About Manish Goel
SEBI Registered Research Analyst • Chartered Accountant
377 Articles Published
Manish Goel is a Chartered Accountant, SEBI Registered Research Analyst, and founder of Manish Goel PMS. A full-time value investor since 2010, he has helped thousands of investors build long-term wealth through quality stock picking and disciplined fundamental analysis.
April 19, 2026
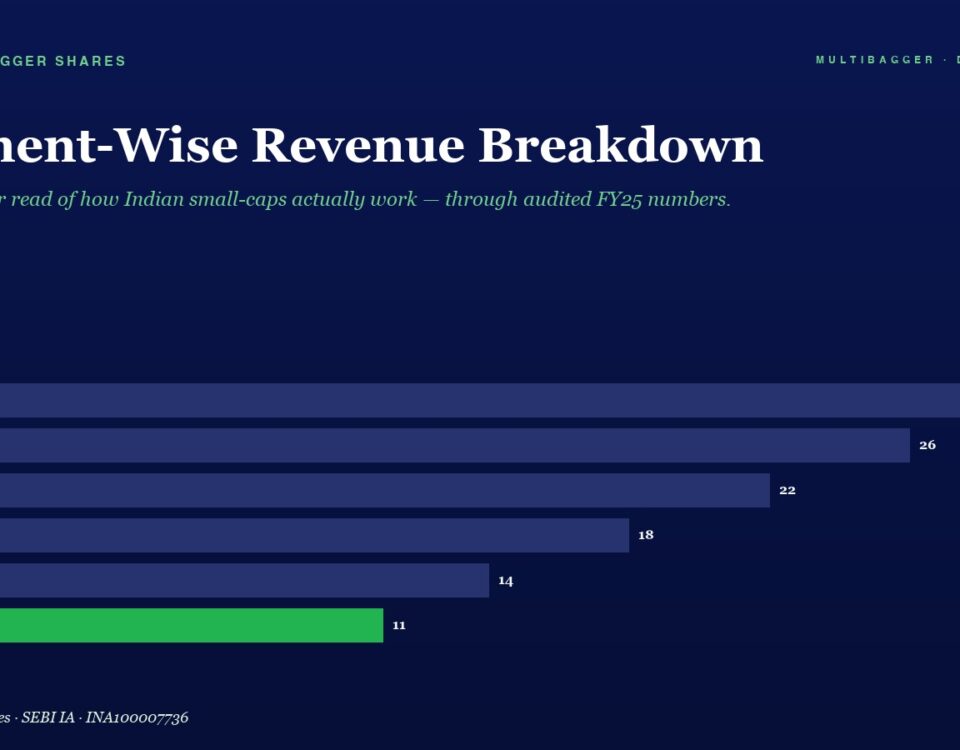
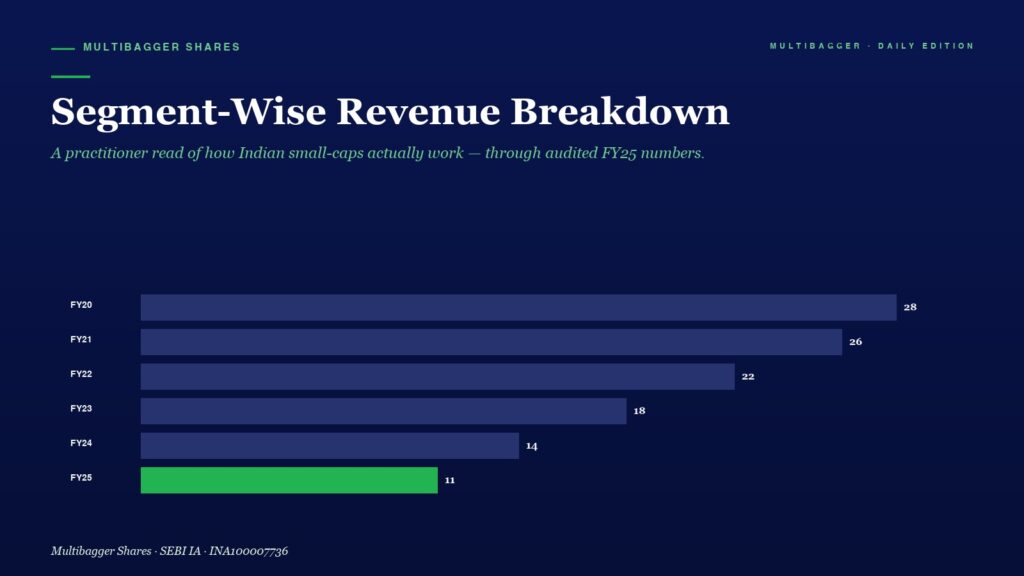
Titan Biotech disclosed only one primary operating segment in FY25, a quiet but powerful sign that the business remains easier to understand and monitor than many small-cap peers.
April 19, 2026
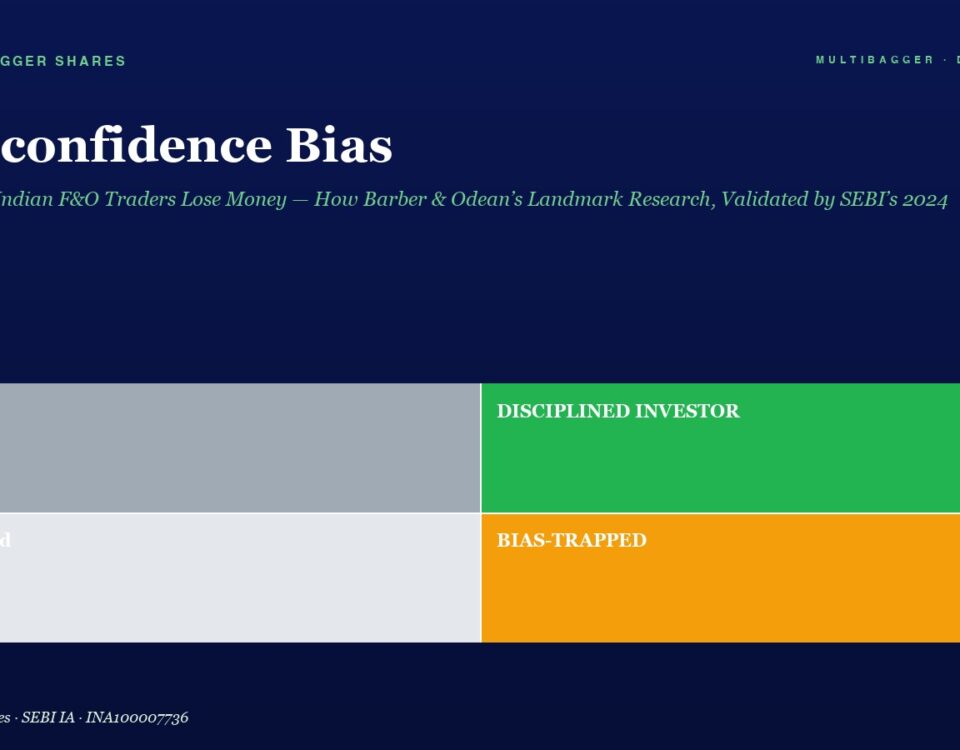
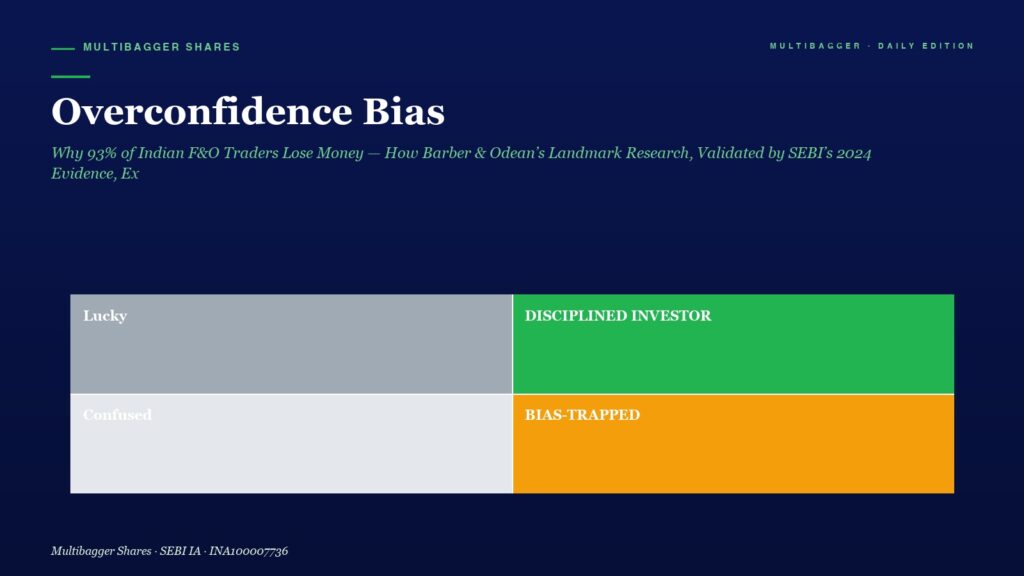
Barber & Odean's Nobel-adjacent 2000 study, validated by SEBI's 2024 evidence that ~93% of Indian retail F&O traders lose money, explains the meta-bias that makes every other cognitive error worse — and the 8-question pre-trade checklist that disarms it.
April 19, 2026
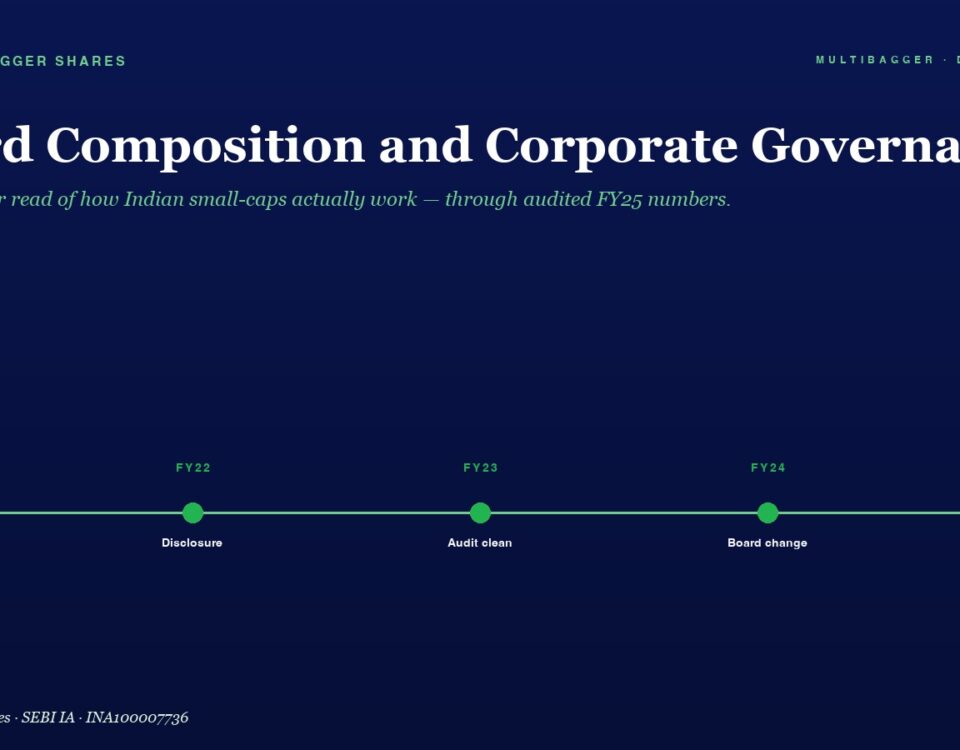
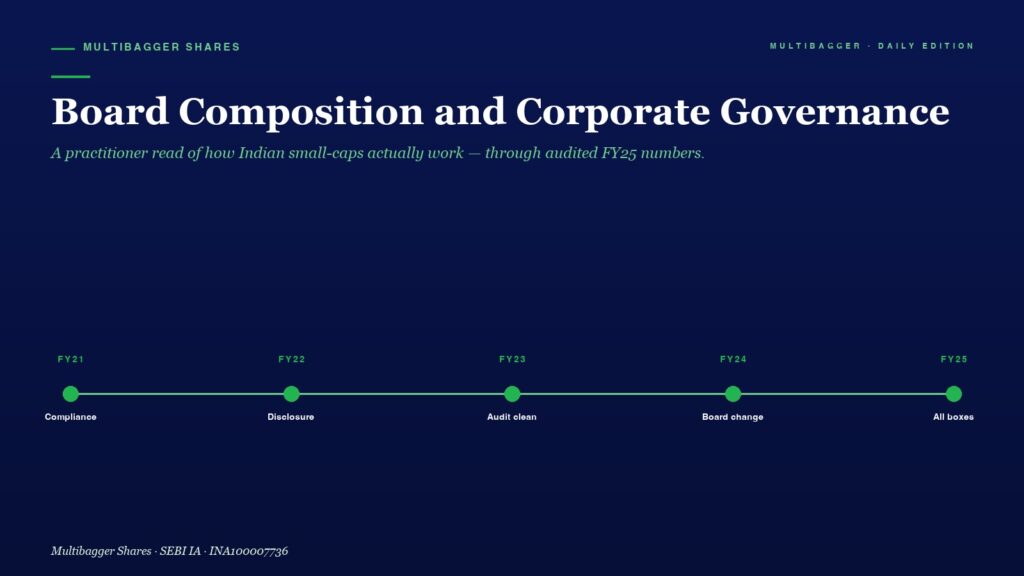
Titan Biotech ended FY25 with an 11-member board, four independent directors, an independent chair, and 14 board meetings - a governance structure that merits serious attention from long-term investors.
April 19, 2026
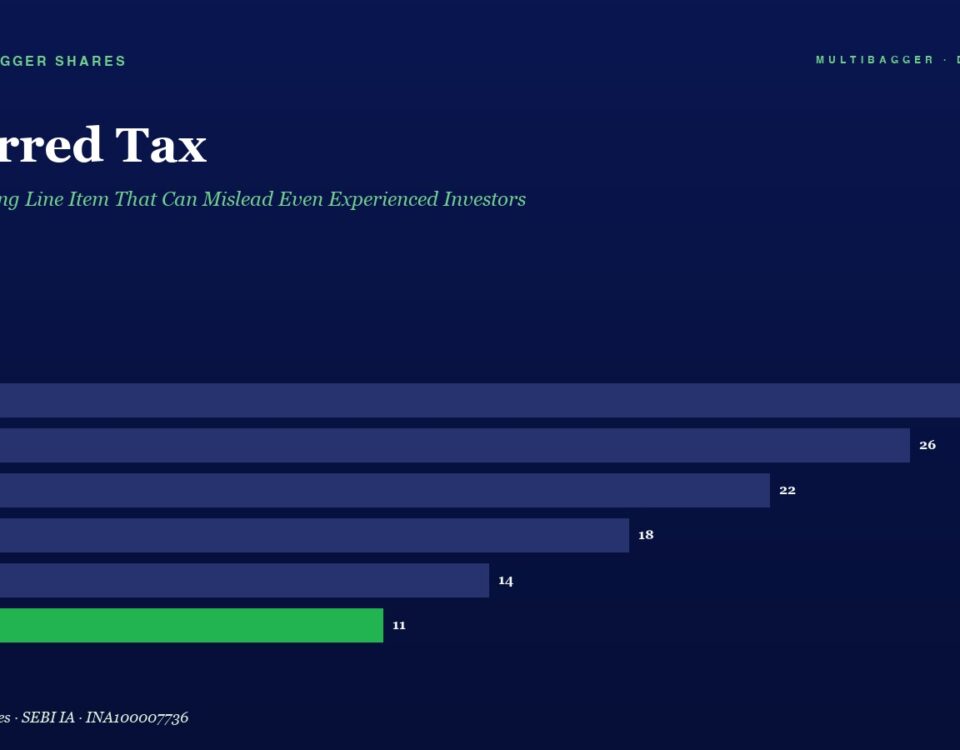
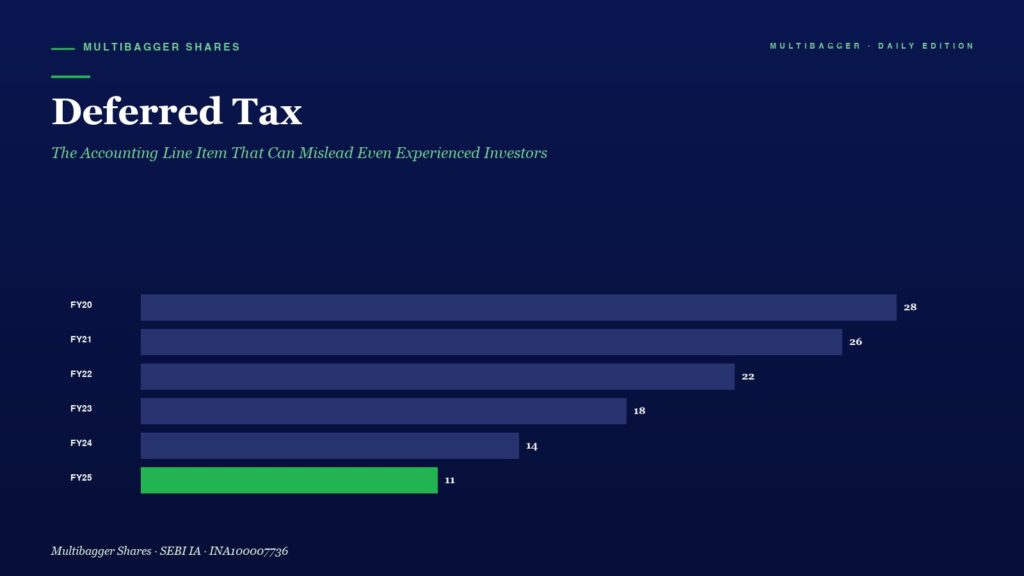
Deferred tax can quietly change how reported profit should be read. The line is less about jargon and more about timing, profit quality, and whether management disclosure deserves trust.