March 20, 2026
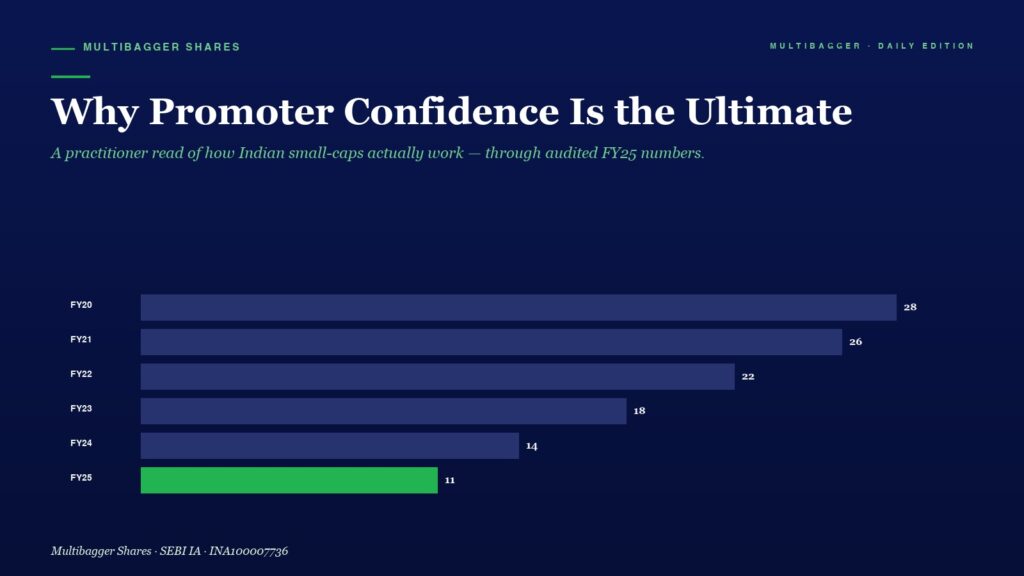
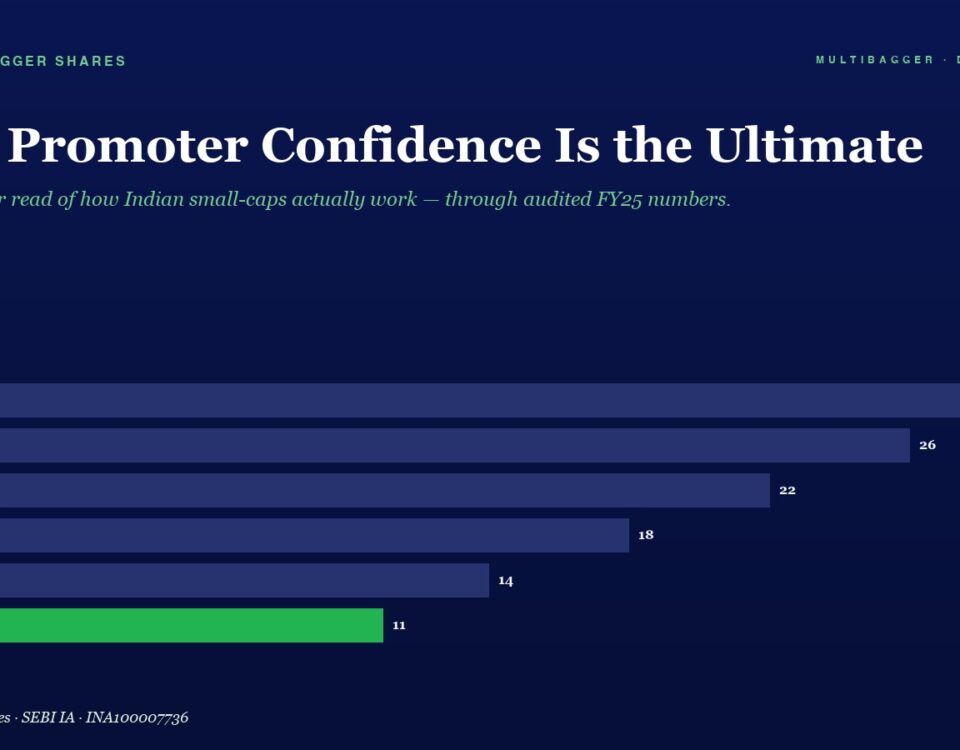
Horizontal bar chart of promoter confidence by fiscal year (FY20–FY25); FY25 is green at 11, others are 28, 26, 22, 18, 14.

Why Promoter Confidence Is the Ultimate Quality Signal

MGMANISH GOEL PMS☰ HomePast PerformanceServicesMedia & PressBlogsAwards WhatsApp · 7380122211 VALUE INVESTING · BLOG Why Promoter Confidence Is the Ultimate Quality Signal ← ALL ARTICLES 📅 […]
March 20, 2026
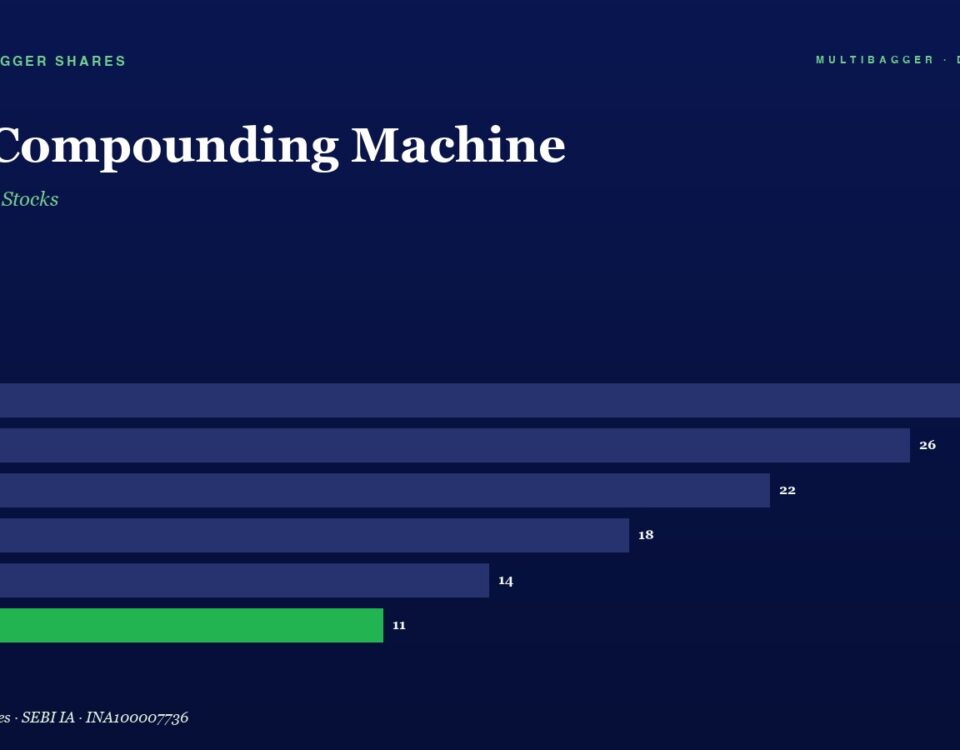
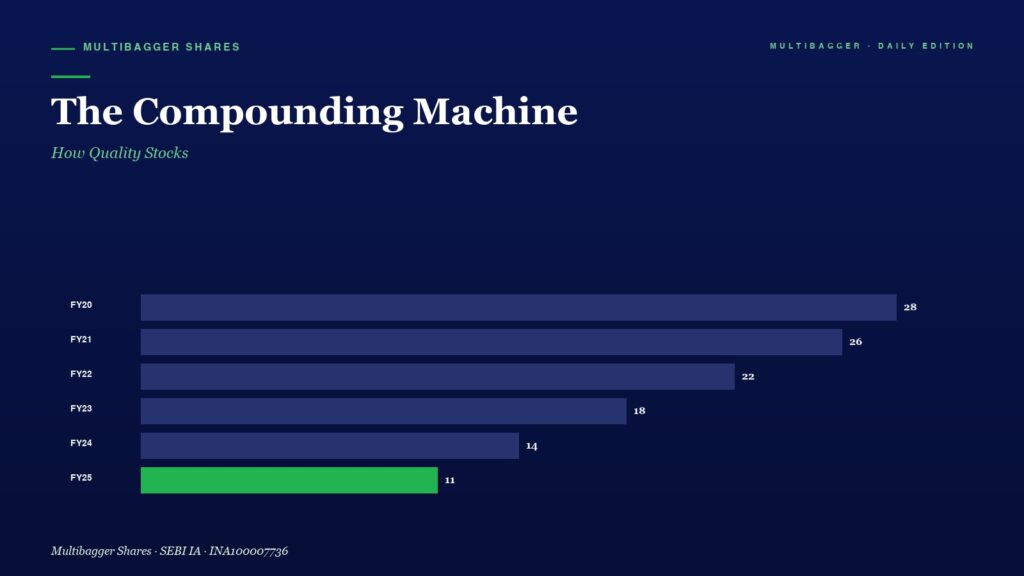
Title and subtitle: 'The Compounding Machine' with subtitle 'How Quality Stocks' on a dark blue background; below is a horizontal bar chart of FY20–FY25 values, with bars and right-aligned numbers 28, 26, 22, 18, 14, and a green 11 for FY25.

The Compounding Machine: How Quality Stocks

MGMANISH GOEL PMS☰ HomePast PerformanceServicesMedia & PressBlogsAwards WhatsApp · 7380122211 VALUE INVESTING · BLOG The Compounding Machine: How Quality Stocks ← ALL ARTICLES 📅 Published March […]
March 18, 2026
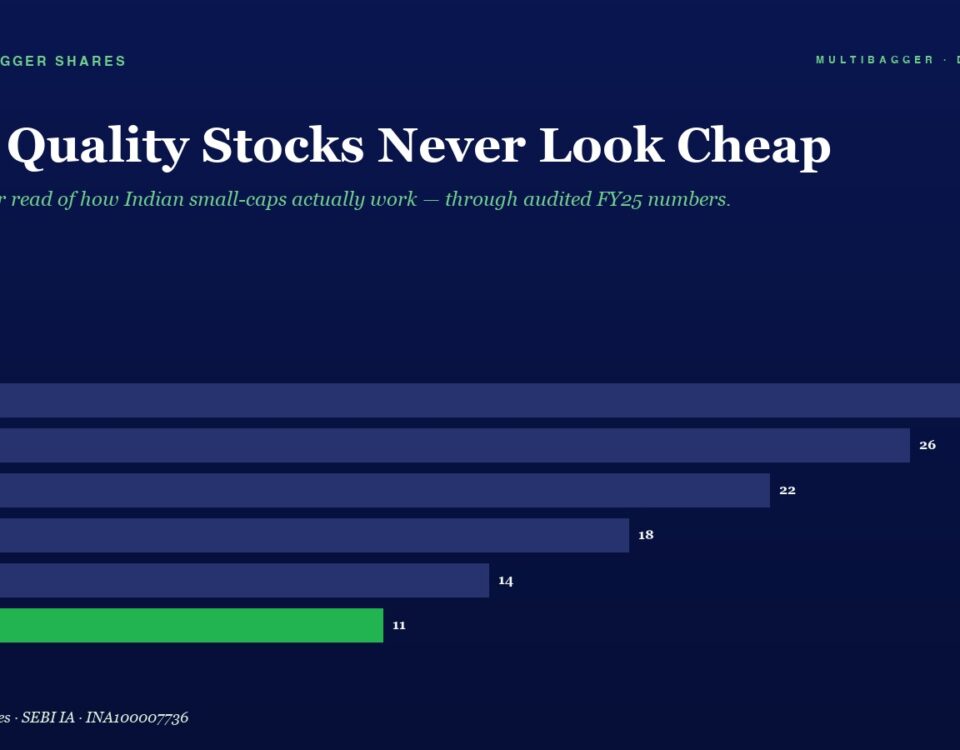
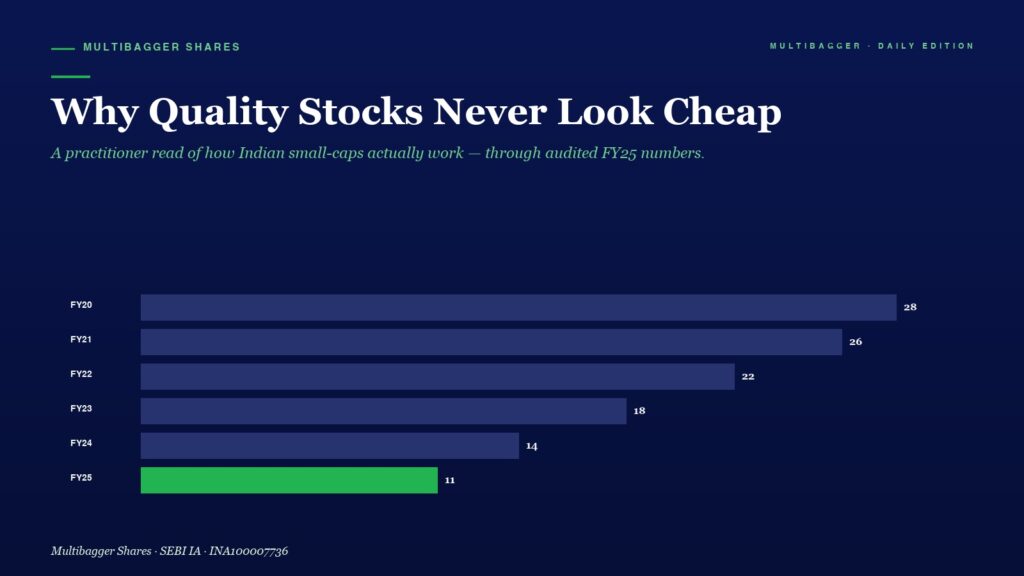
Infographic titled 'Why Quality Stocks Never Look Cheap' showing a horizontal bar chart of FY20 to FY25 values; bars decrease from 28 to 11, with FY25 highlighted in green.

Why Quality Stocks Never Look Cheap — And Why That’s Actually a Good Sign

MGMANISH GOEL PMS☰ HomePast PerformanceServicesMedia & PressBlogsAwards WhatsApp · 7380122211 VALUE INVESTING · BLOG Why Quality Stocks Never Look Cheap — And Why That’s Actually a […]
March 18, 2026
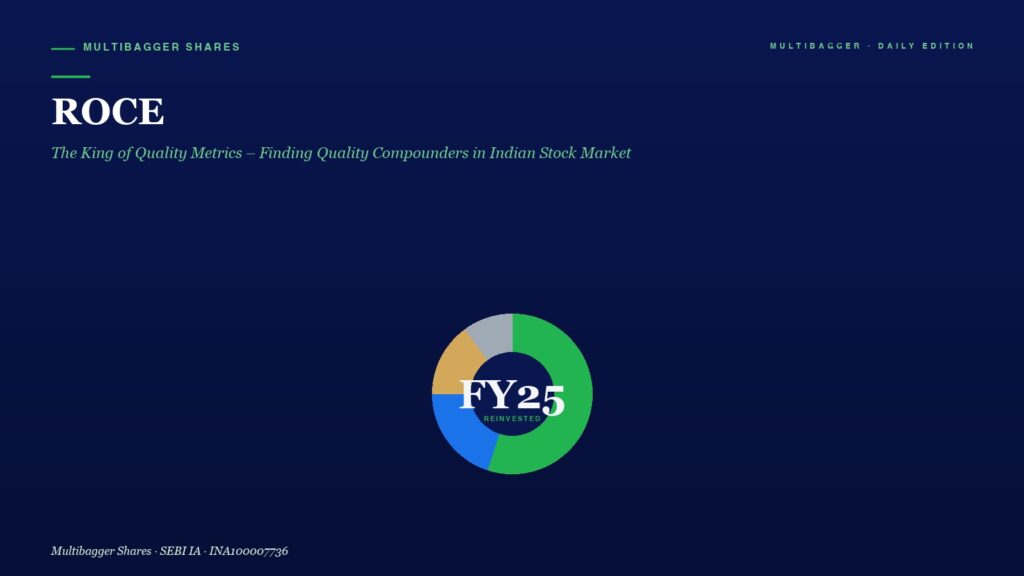
Hero section with ROCE title and green subtitle on a deep blue gradient; a multicolor donut chart labeled FY25 reinvested sits in the center.

ROCE: The King of Quality Metrics – Finding Quality Compounders in Indian Stock Market

MGMANISH GOEL PMS☰ HomePast PerformanceServicesMedia & PressBlogsAwards WhatsApp · 7380122211 VALUE INVESTING · BLOG ROCE: The King of Quality Metrics – Finding Quality Compounders in Indian […]
+91-7380122211