
Blog
April 8, 2026
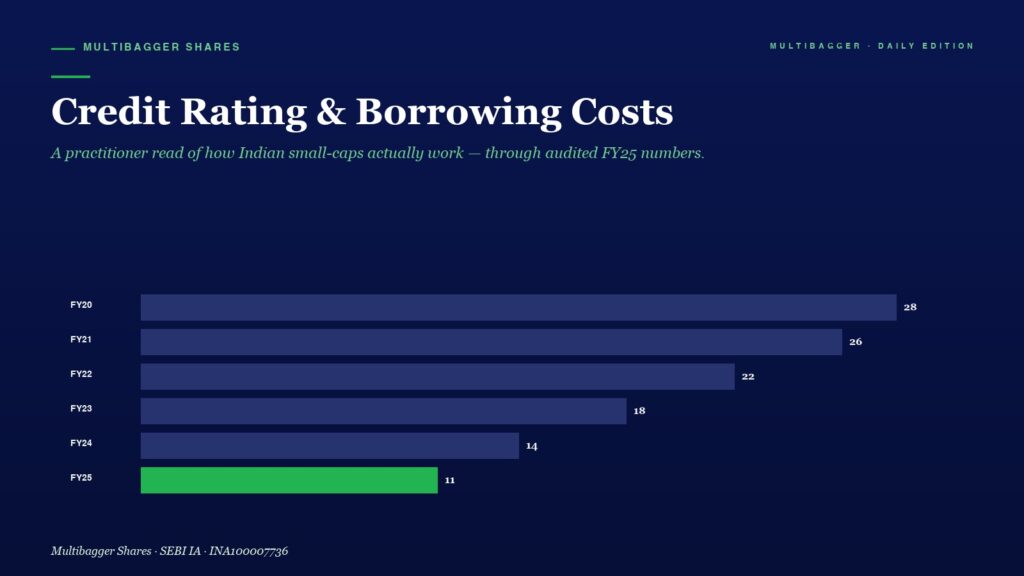
MGMANISH GOEL PMS☰ HomePast PerformanceServicesMedia & PressBlogsAwards WhatsApp · 7380122211 VALUE INVESTING · BLOG Credit Rating & Borrowing Costs ← ALL ARTICLES Why Credit Ratings and […]
April 8, 2026
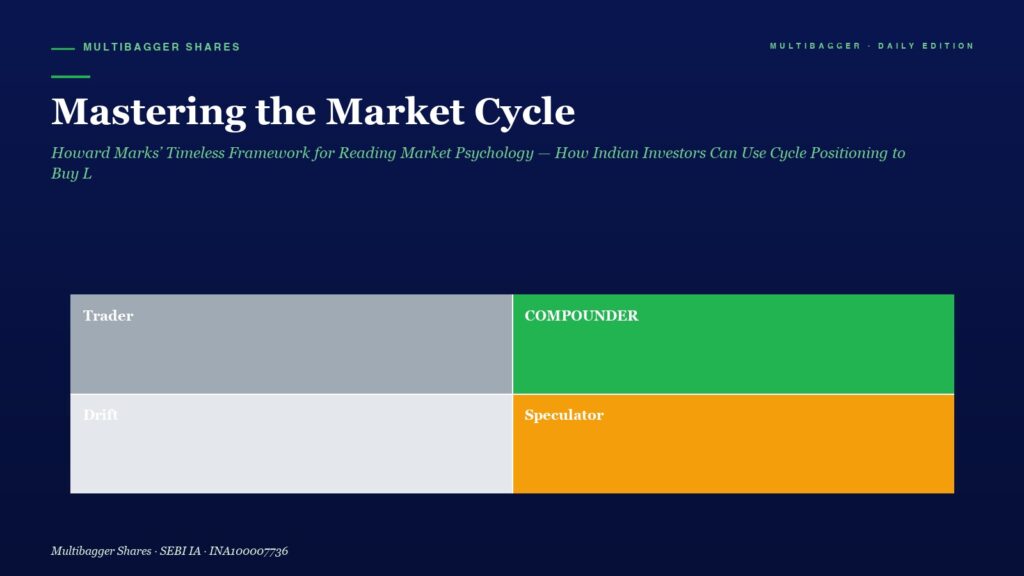
MGMANISH GOEL PMS☰ HomePast PerformanceServicesMedia & PressBlogsAwards WhatsApp · 7380122211 VALUE INVESTING · BLOG Mastering the Market Cycle: Howard Marks’ Timeless Framework for Reading Market Psychology […]
April 8, 2026
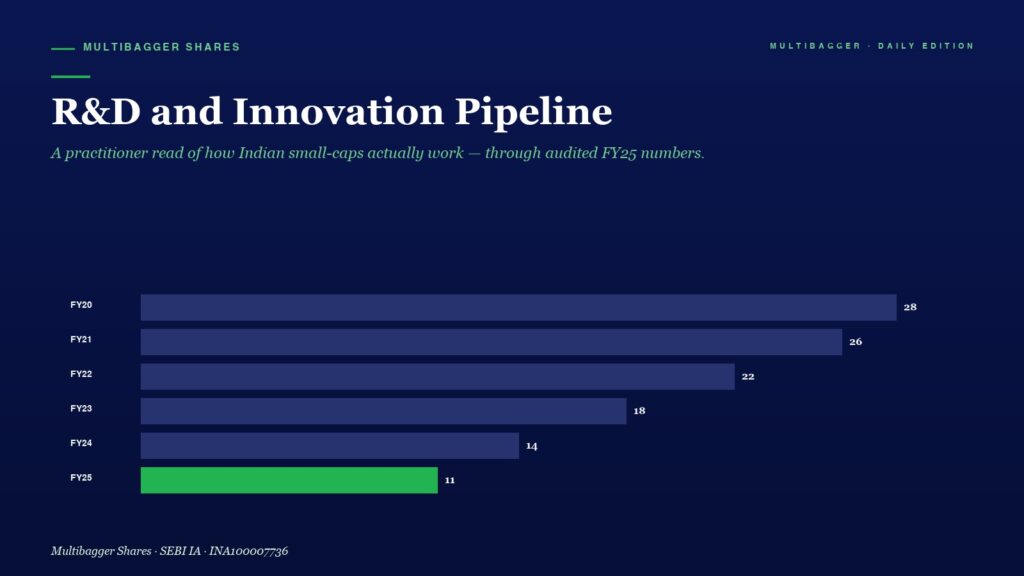
Titan Biotech's R&D spend grew 39.5% YoY to ₹18.39 lakhs — generating ₹850 of revenue per ₹1 of R&D. With 100+ products across 7 categories, zero imported technology, and a new health supplement pipeline, this is process innovation that compounds. A deep-dive case study.
April 8, 2026
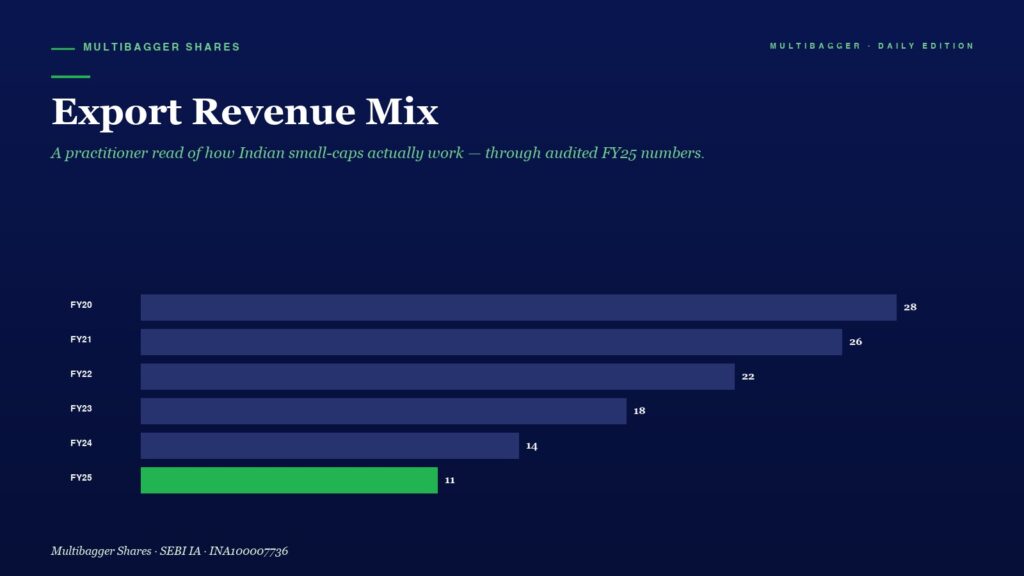
Titan Biotech earns ₹53.90 crore from overseas markets across 100+ countries — 34.5% of total revenue. With a 3:1 forex earned-to-used ratio and a net forex surplus of ₹35.75 crore, this small-cap has built genuine international competitive strength. A deep-dive case study.