April 2, 2026
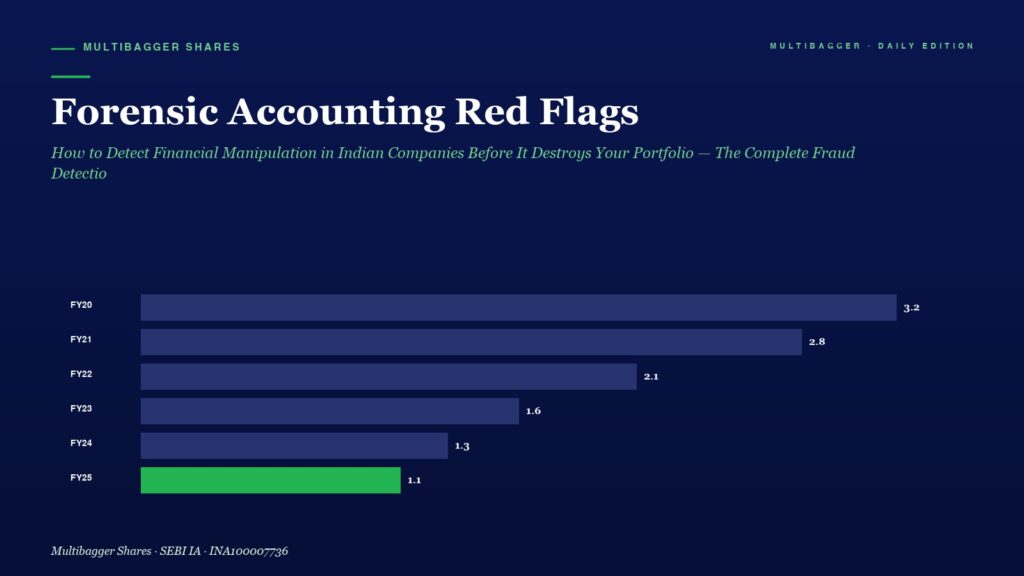
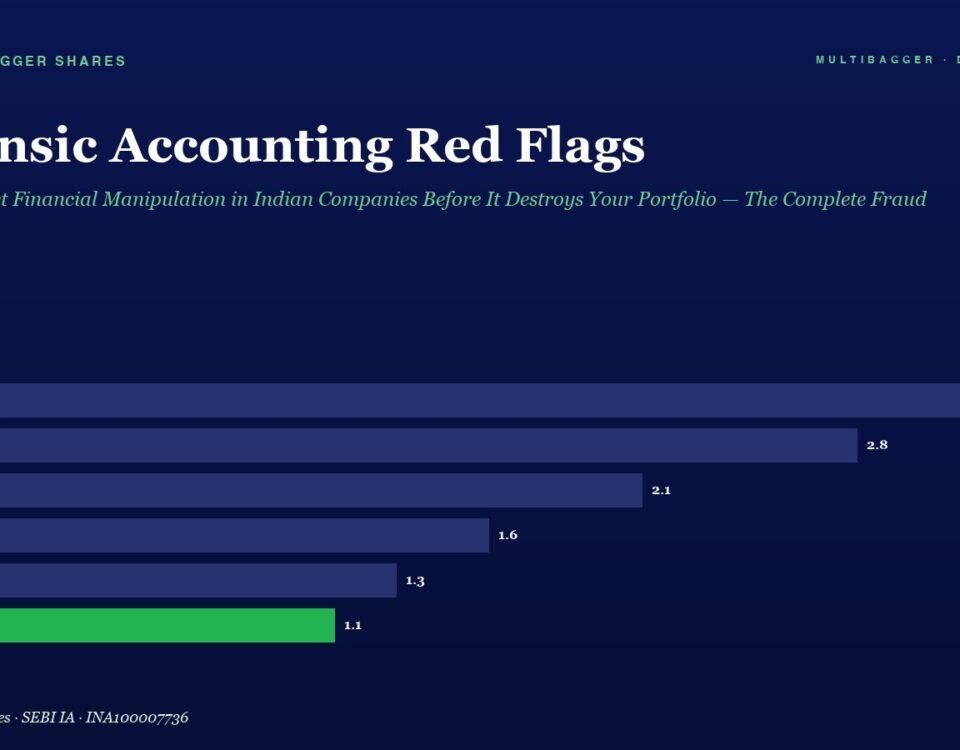
Infographic: Forensic Accounting Red Flags with a horizontal bar chart of yearly values from FY20 to FY25; FY25 is 1.1 (green).

Forensic Accounting Red Flags: How to Detect Financial Manipulation in Indian Companies Before It Destroys Your Portfolio — The Complete Fraud Detection Toolkit for Smart Value Investors

MGMANISH GOEL PMS☰ HomePast PerformanceServicesMedia & PressBlogsAwards WhatsApp · 7380122211 VALUE INVESTING · BLOG Forensic Accounting Red Flags: How to Detect Financial Manipulation in Indian Companies […]
April 2, 2026
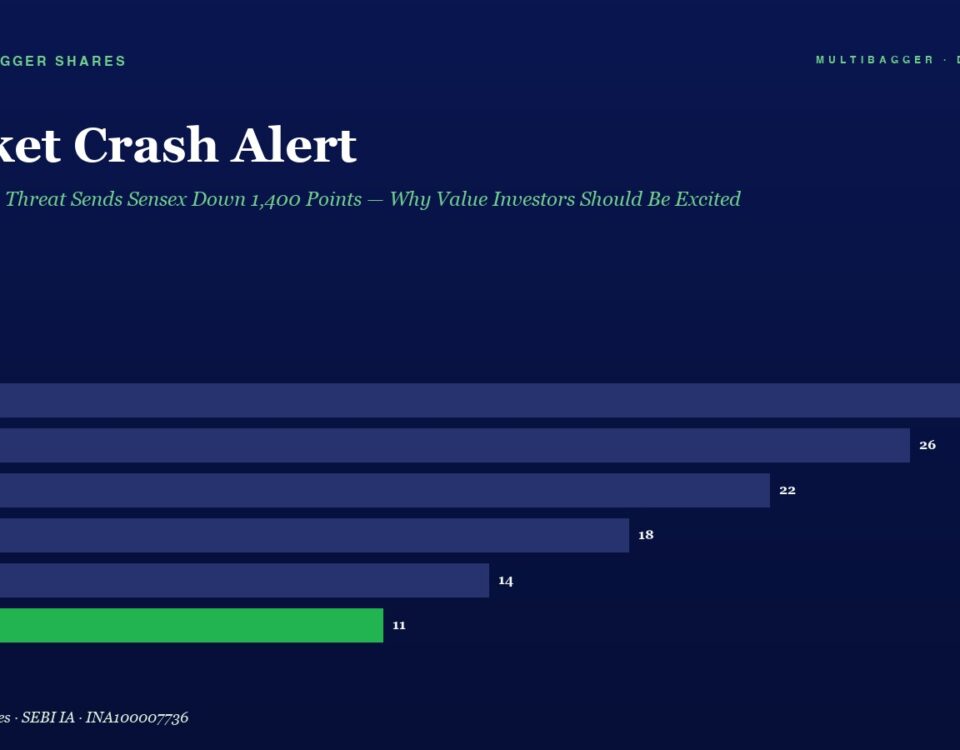
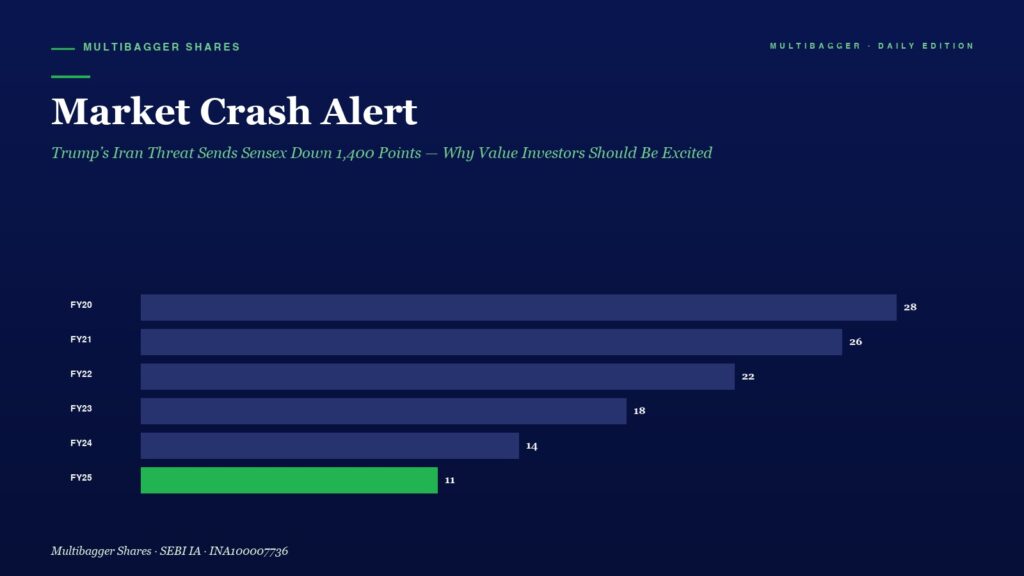
Market Crash Alert page with a horizontal bar chart showing FY20 28, FY21 26, FY22 22, FY23 18, FY24 14, and FY25 11 (green) beneath the headline.

Market Crash Alert: Trump’s Iran Threat Sends Sensex Down 1,400 Points — Why Value Investors Should Be Excited

Indian markets crashed over 2% on Trump's Iran war threat before recovering sharply. Sensex lost 1,400 points, crude oil surged past $105. Here's what value investors should do — by Manish Goel at manishgoelpms.com
April 2, 2026
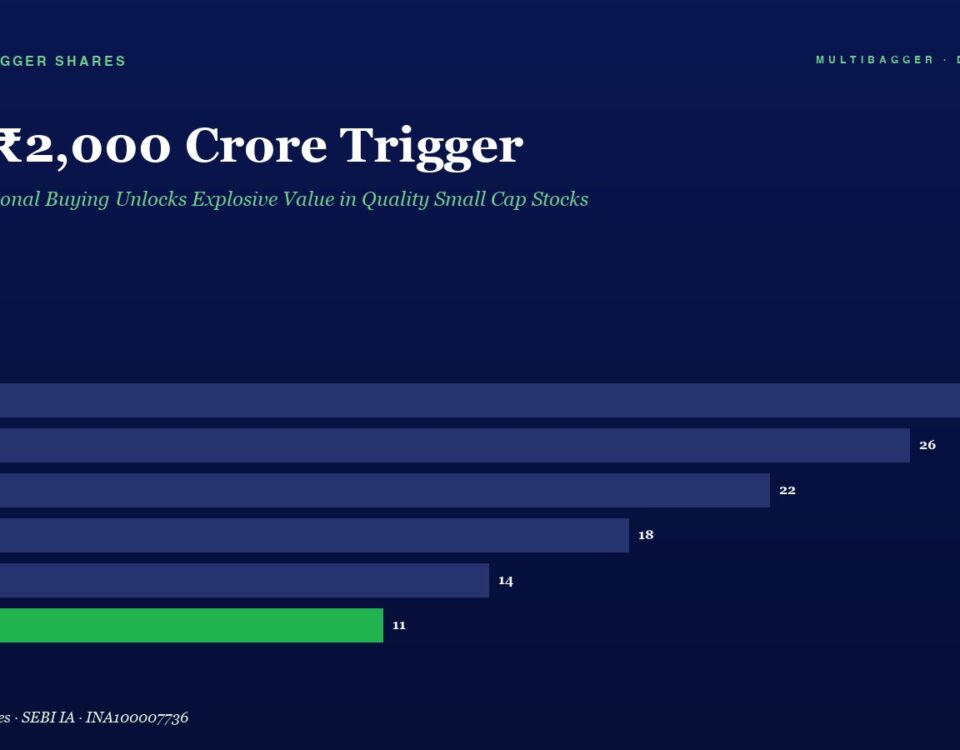
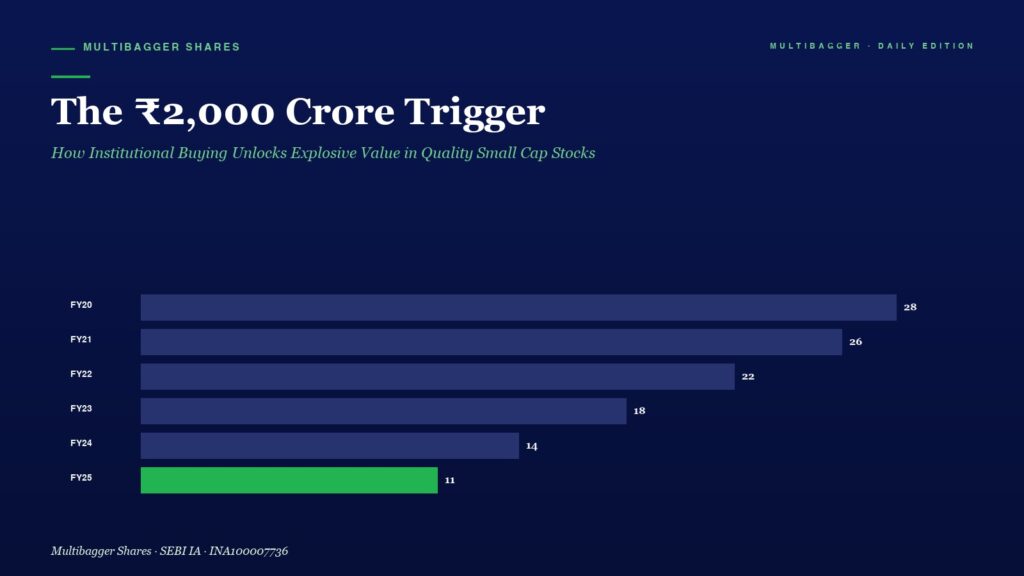
Hero image with the headline 'The ₹2,000 Crore Trigger' and a horizontal bar chart of FY20–FY25 values, FY25 bar in green (11).

The ₹2,000 Crore Trigger: How Institutional Buying Unlocks Explosive Value in Quality Small Cap Stocks

MGMANISH GOEL PMS☰ HomePast PerformanceServicesMedia & PressBlogsAwards WhatsApp · 7380122211 VALUE INVESTING · BLOG The ₹2,000 Crore Trigger: How Institutional Buying Unlocks Explosive Value in Quality […]
April 2, 2026
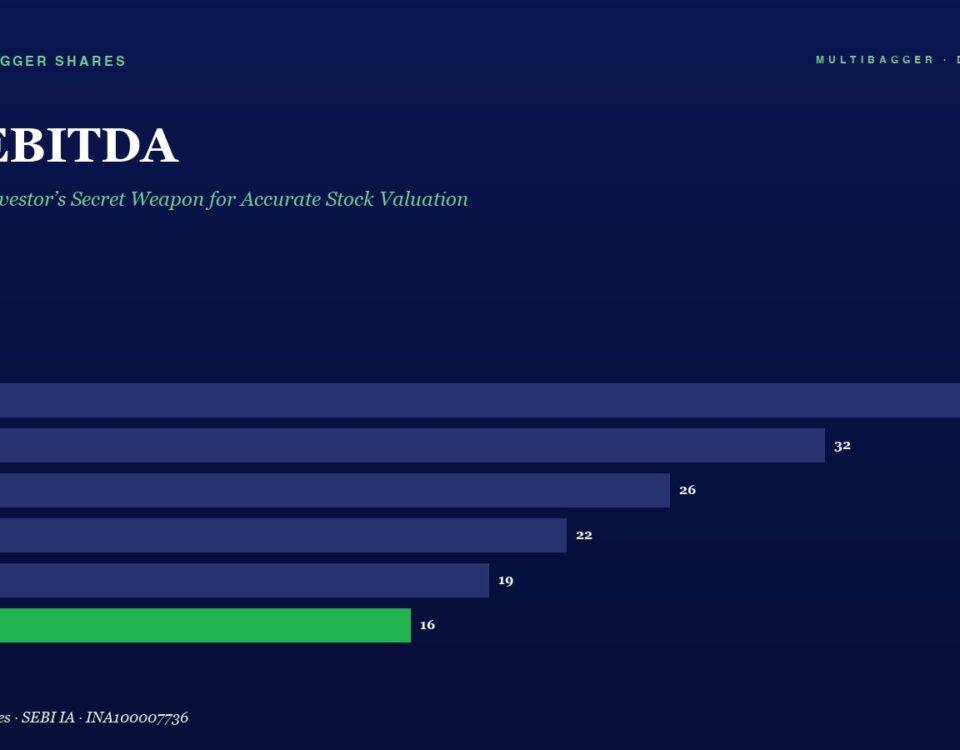
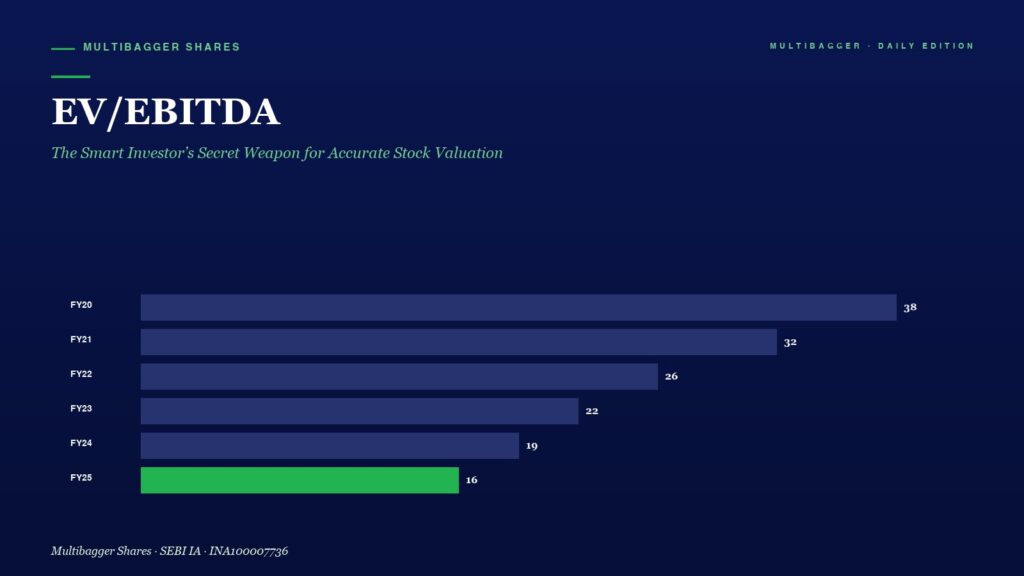
Bar chart titled EV/EBITDA showing declining values from FY20 to FY25: FY20 38, FY21 32, FY22 26, FY23 22, FY24 19, FY25 16; green bar highlights FY25.

EV/EBITDA: The Smart Investor’s Secret Weapon for Accurate Stock Valuation

Learn how EV/EBITDA — the valuation ratio used by institutional investors and private equity — can help you identify undervalued Indian stocks and multibagger opportunities with greater accuracy than the traditional P/E ratio.
+91-7380122211