April 3, 2026
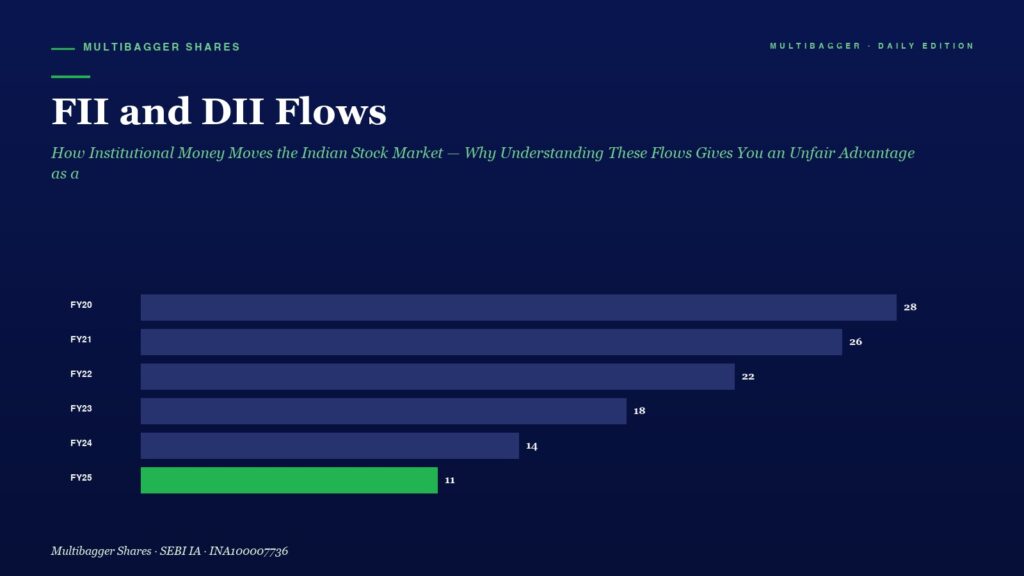
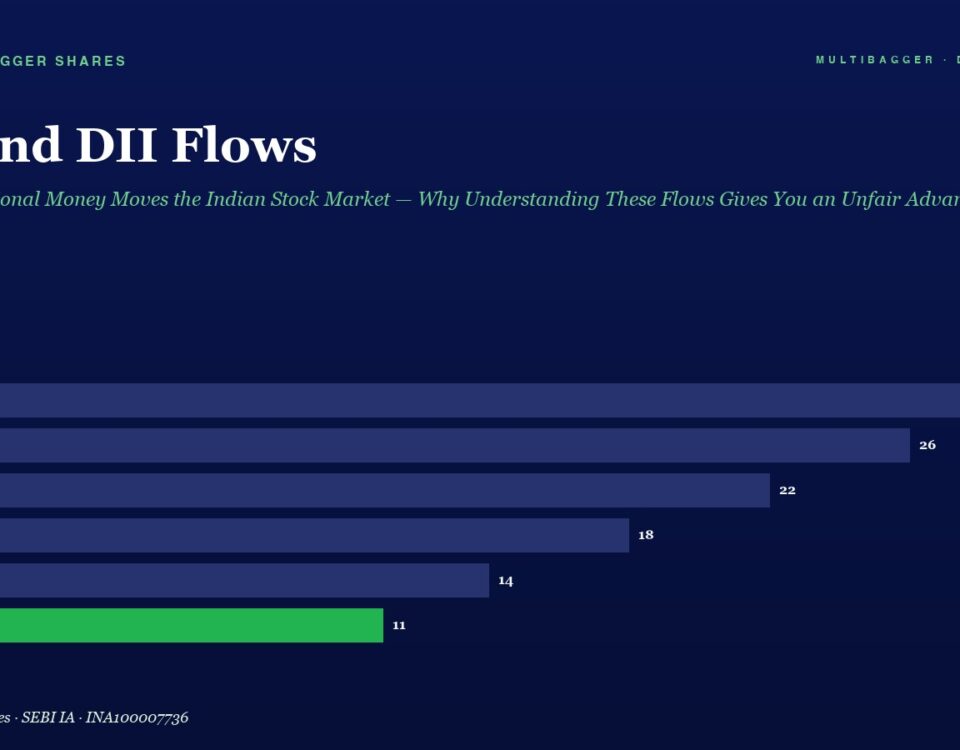
Infographic showing FI and DII flows by fiscal year, from FY20 to FY25, with bars values 28, 26, 22, 18, 14, and 11 (FY25 highlighted in green).

FII and DII Flows: How Institutional Money Moves the Indian Stock Market — Why Understanding These Flows Gives You an Unfair Advantage as a Value Investor

MGMANISH GOEL PMS☰ HomePast PerformanceServicesMedia & PressBlogsAwards WhatsApp · 7380122211 VALUE INVESTING · BLOG FII and DII Flows: How Institutional Money Moves the Indian Stock Market […]
April 3, 2026
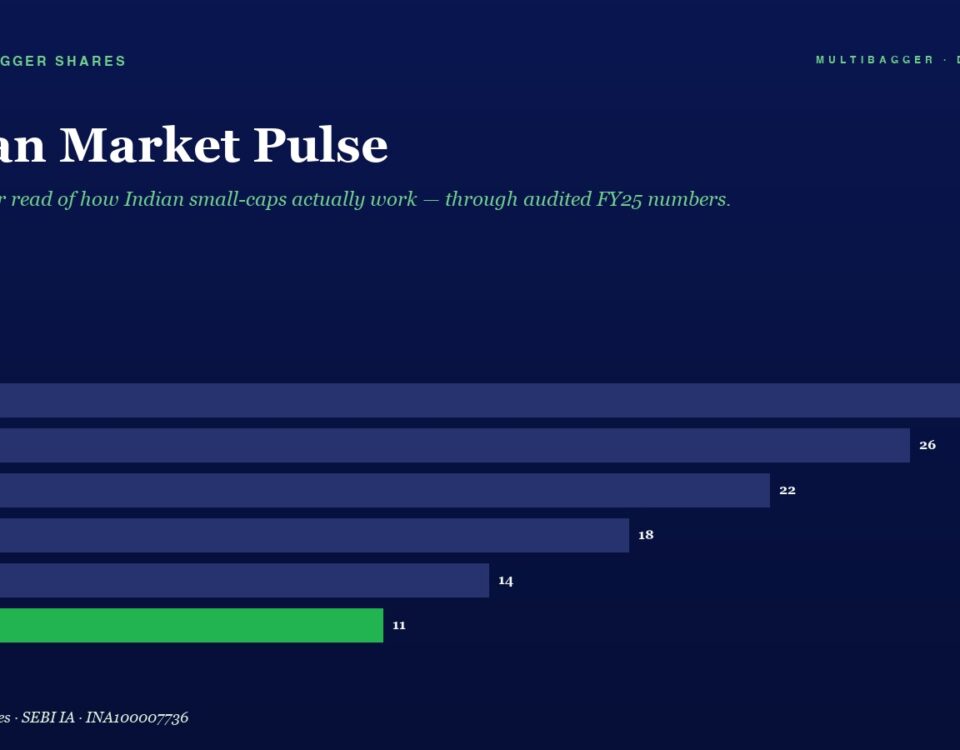
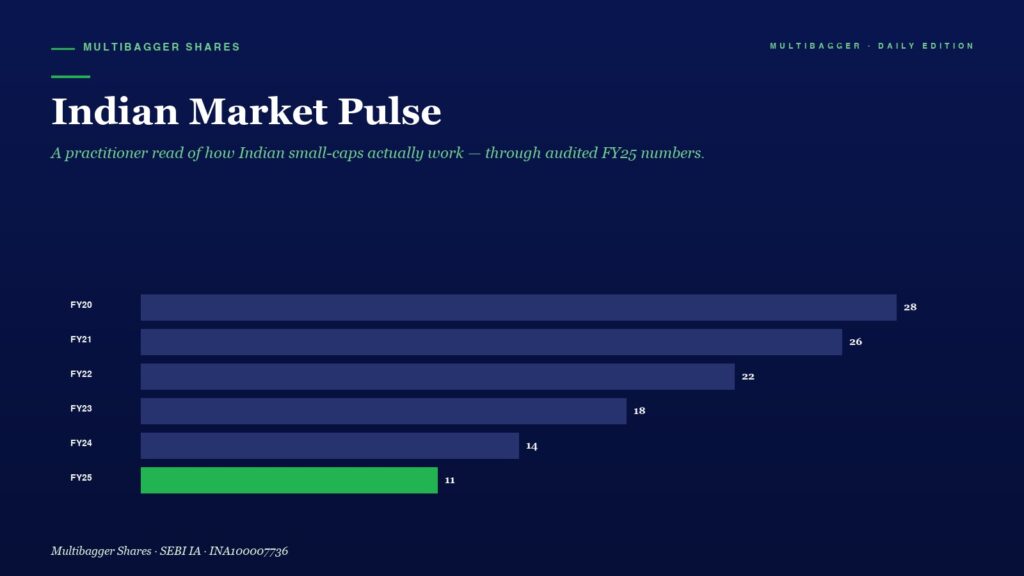
Infographic titled Indian Market Pulse with a horizontal bar chart of FY20–FY25; values 28, 26, 22, 18, 14, 11 (FY25 shown in green).

Indian Market Pulse

MGMANISH GOEL PMS☰ HomePast PerformanceServicesMedia & PressBlogsAwards WhatsApp · 7380122211 VALUE INVESTING · BLOG Indian Market Pulse ← ALL ARTICLES 🇮🇳 Indian Market Pulse — Live […]
April 3, 2026
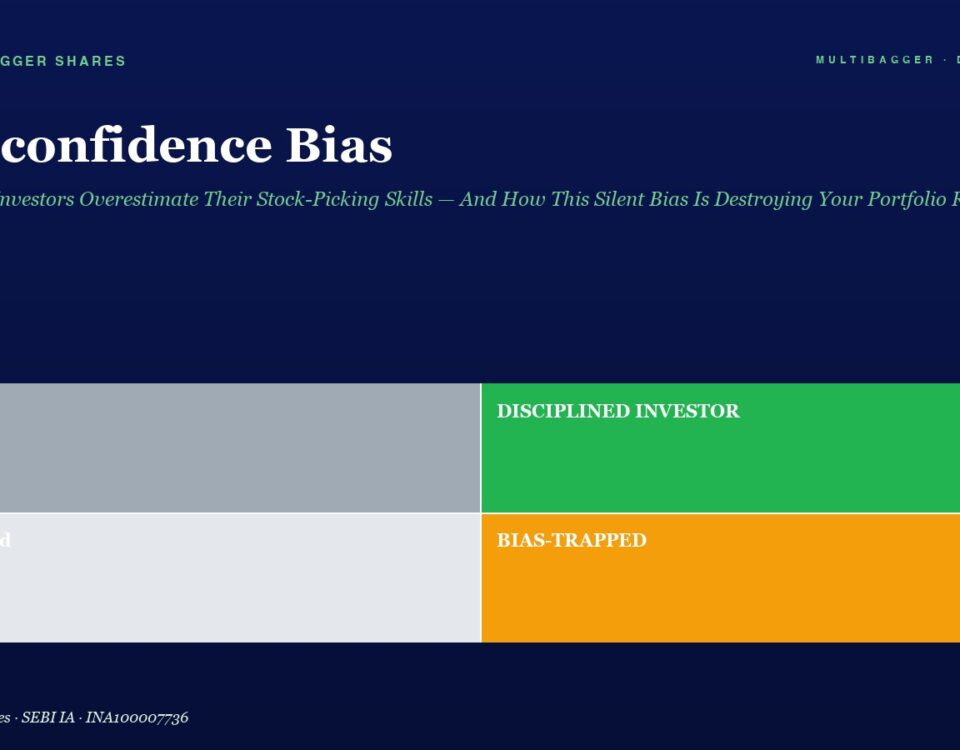
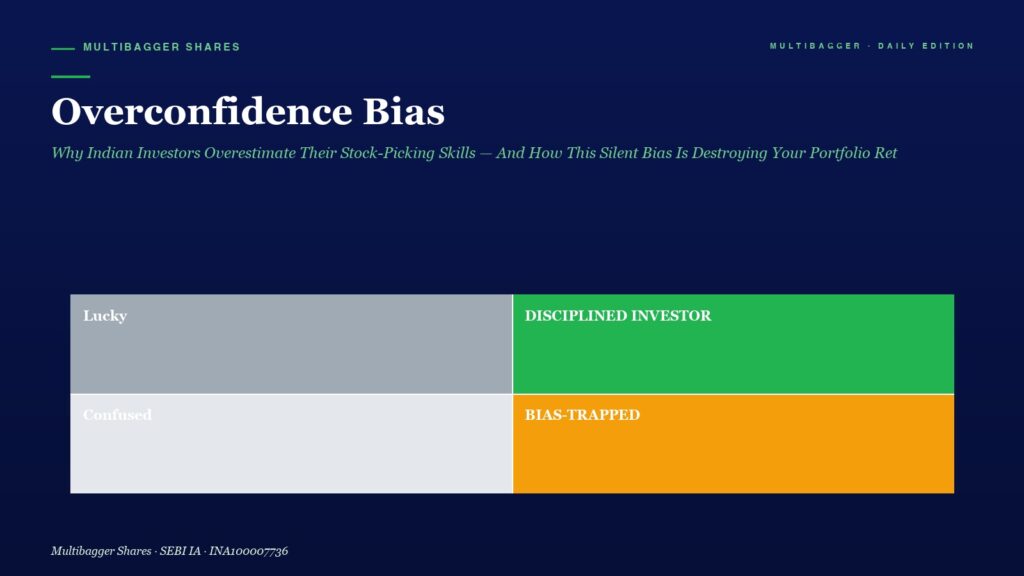
Hero title: Overconfidence Bias with subtitle about Indian investors and stock-picking skills; color-block infographic below showing four states.

Overconfidence Bias: Why Indian Investors Overestimate Their Stock-Picking Skills — And How This Silent Bias Is Destroying Your Portfolio Returns

MGMANISH GOEL PMS☰ HomePast PerformanceServicesMedia & PressBlogsAwards WhatsApp · 7380122211 VALUE INVESTING · BLOG Overconfidence Bias: Why Indian Investors Overestimate Their Stock-Picking Skills — And How […]
April 3, 2026
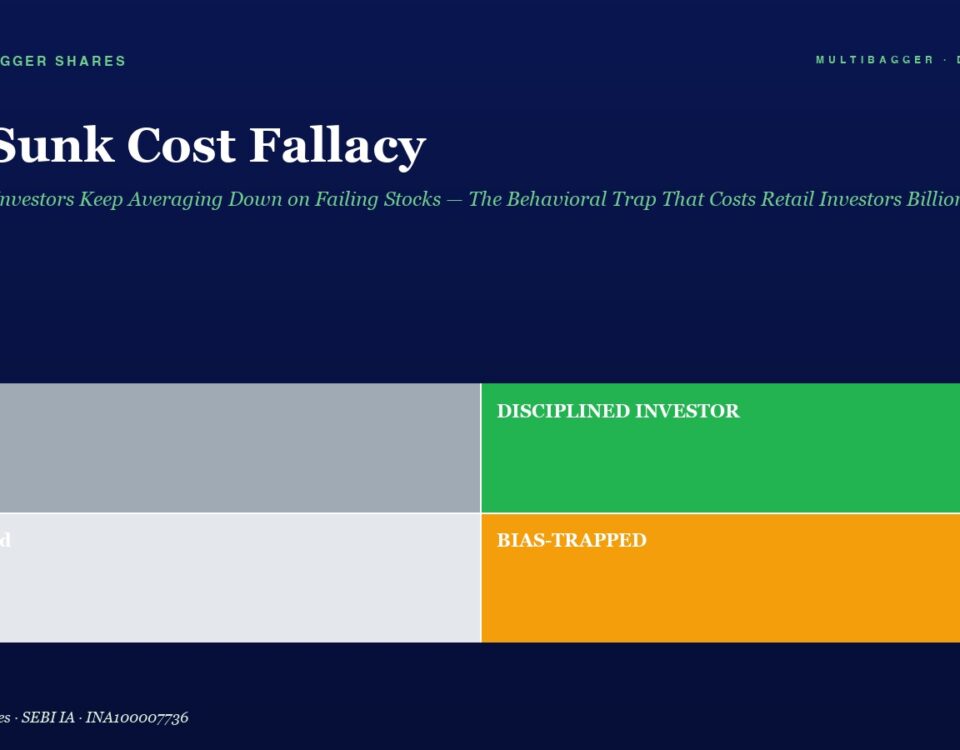
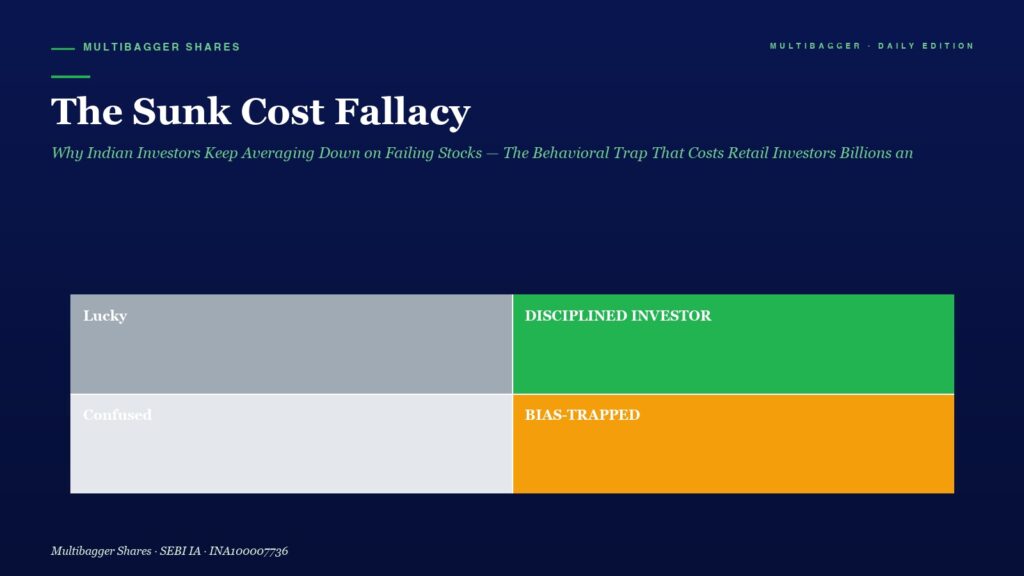
Hero header for an article: The Sunk Cost Fallacy with subtitle; a four-panel color infographic labeled Lucky, Disciplined Investor, Confused, BIAS-TRAPPED.

The Sunk Cost Fallacy: Why Indian Investors Keep Averaging Down on Failing Stocks — The Behavioral Trap That Costs Retail Investors Billions and How to Break Free

The Sunk Cost Fallacy is one of the most devastating behavioral traps in Indian investing — it makes investors keep averaging down on failing stocks, losing billions. Learn how to break free with the Fresh Eyes Test and a quarterly portfolio audit framework.
+91-7380122211