April 4, 2026
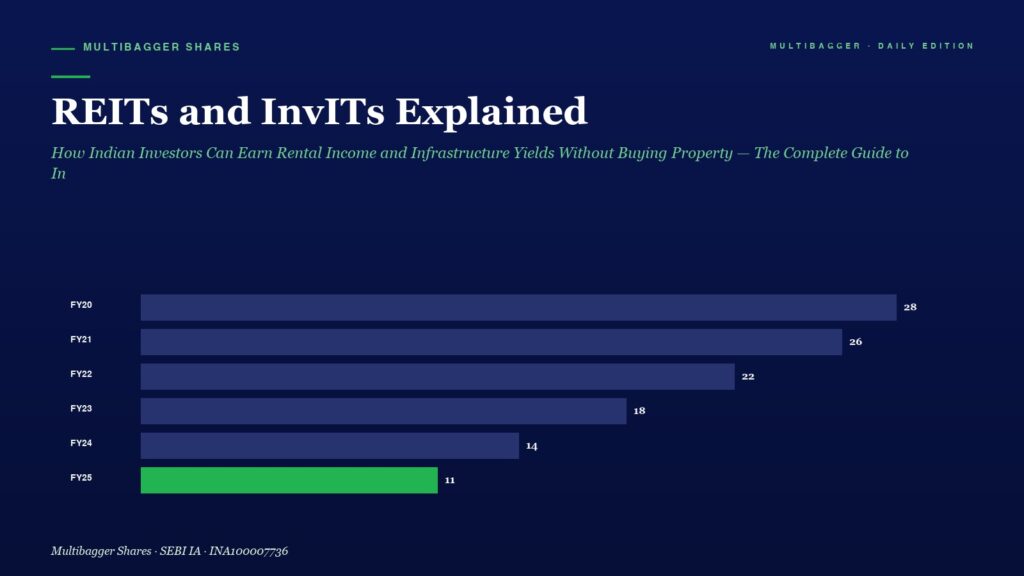
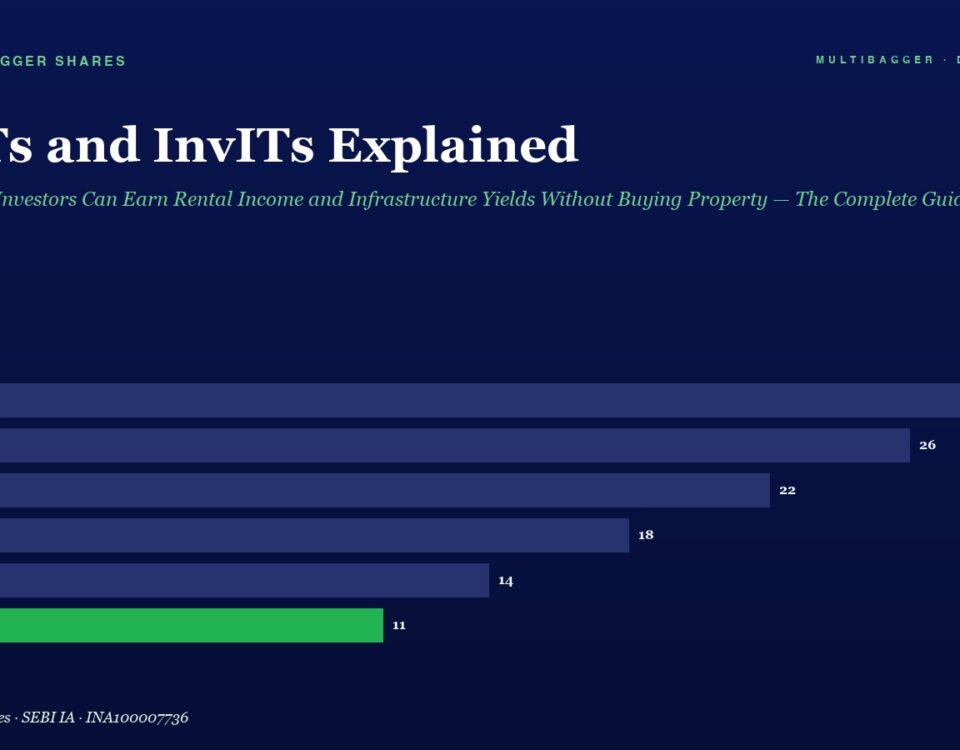
Infographic titled 'REITs and InvTs Explained'; horizontal bar chart shows FY20 28, FY21 26, FY22 22, FY23 18, FY24 14, FY25 11 (FY25 bar in green).

REITs and InvITs Explained: How Indian Investors Can Earn Rental Income and Infrastructure Yields Without Buying Property — The Complete Guide to India’s Most Underused Wealth-Building Instruments

MGMANISH GOEL PMS☰ HomePast PerformanceServicesMedia & PressBlogsAwards WhatsApp · 7380122211 VALUE INVESTING · BLOG REITs and InvITs Explained: How Indian Investors Can Earn Rental Income and […]
April 4, 2026
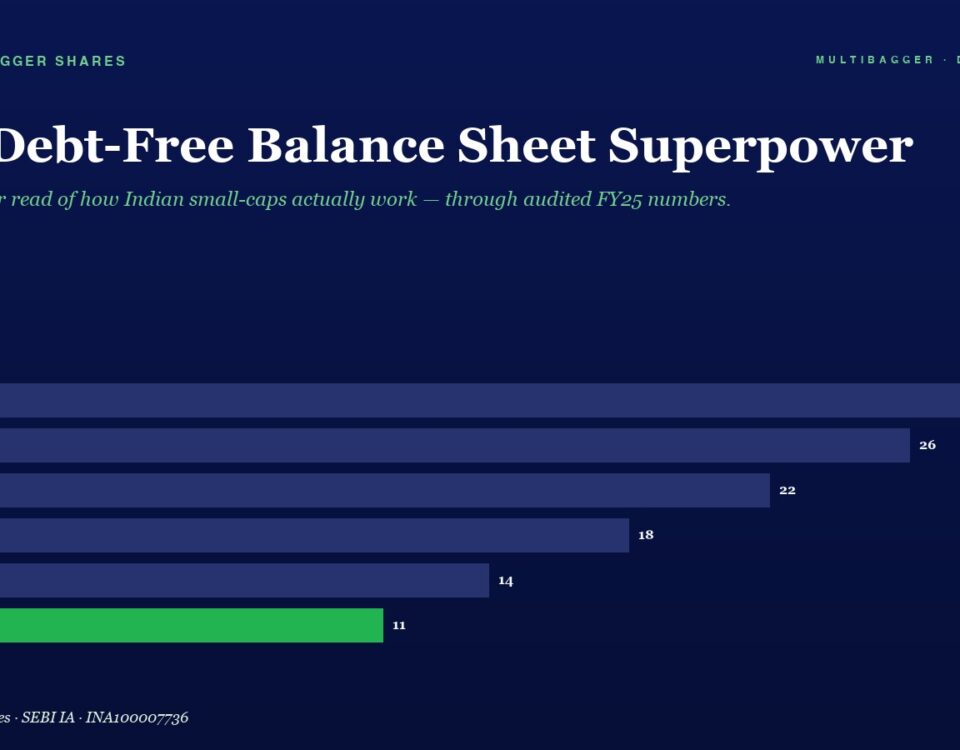
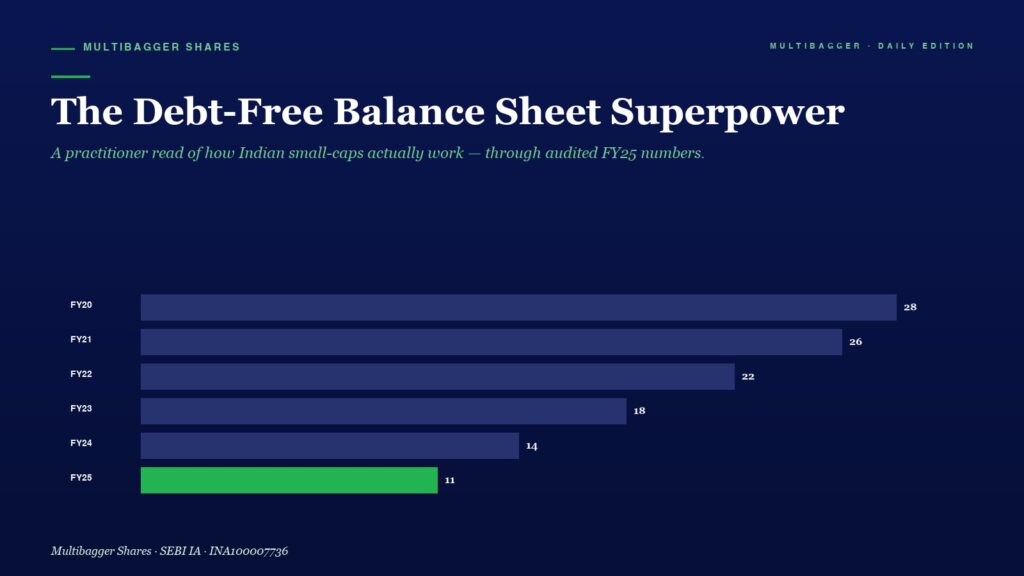
Hero image with the title 'The Debt-Free Balance Sheet Superpower' and a dark-blue bar chart of FY20–FY25 values (28 to 11).

The Debt-Free Balance Sheet Superpower

MGMANISH GOEL PMS☰ HomePast PerformanceServicesMedia & PressBlogsAwards WhatsApp · 7380122211 VALUE INVESTING · BLOG The Debt-Free Balance Sheet Superpower ← ALL ARTICLES 📅 Published April 4, […]
April 4, 2026
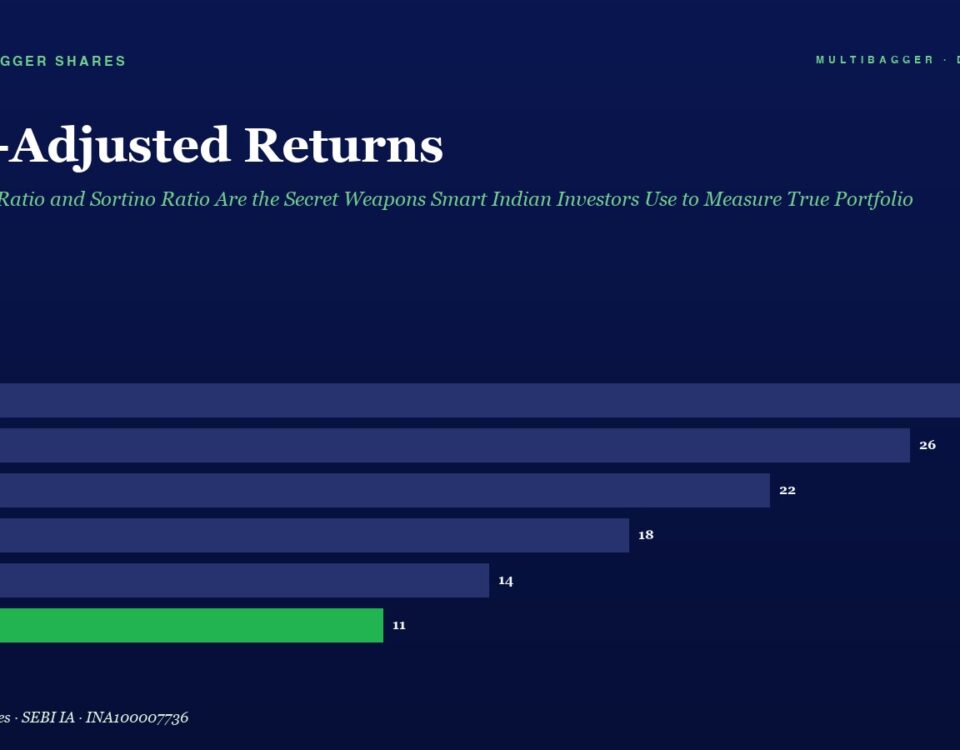
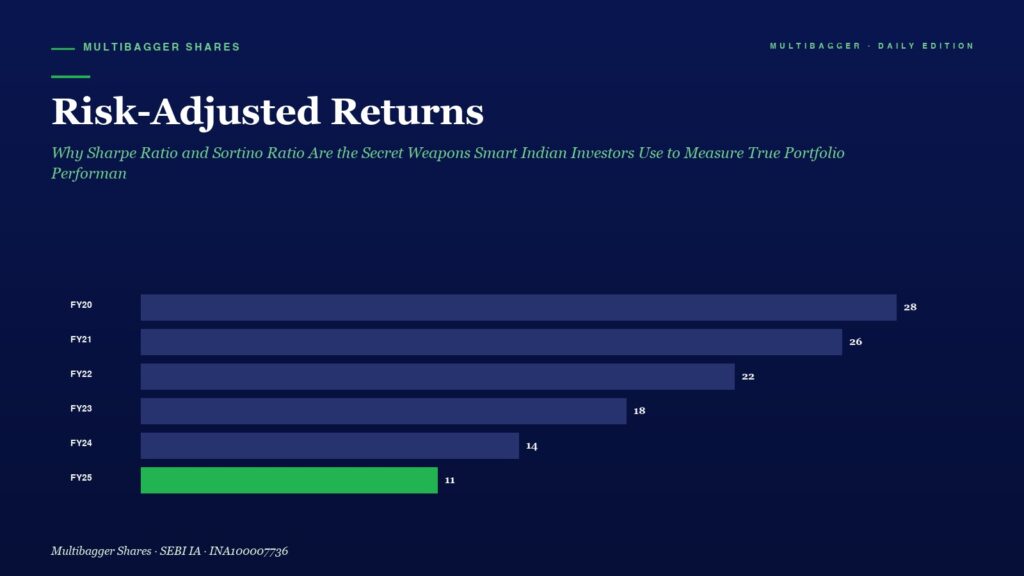
Infographic: Risk-Adjusted Returns with a stacked bar chart showing FY20–FY25 values, ending with FY25 at 11 (green bar).

Risk-Adjusted Returns: Why Sharpe Ratio and Sortino Ratio Are the Secret Weapons Smart Indian Investors Use to Measure True Portfolio Performance — Stop Chasing Raw Returns and Start Measuring What Really Matters

MGMANISH GOEL PMS☰ HomePast PerformanceServicesMedia & PressBlogsAwards WhatsApp · 7380122211 VALUE INVESTING · BLOG Risk-Adjusted Returns: Why Sharpe Ratio and Sortino Ratio Are the Secret Weapons […]
April 4, 2026
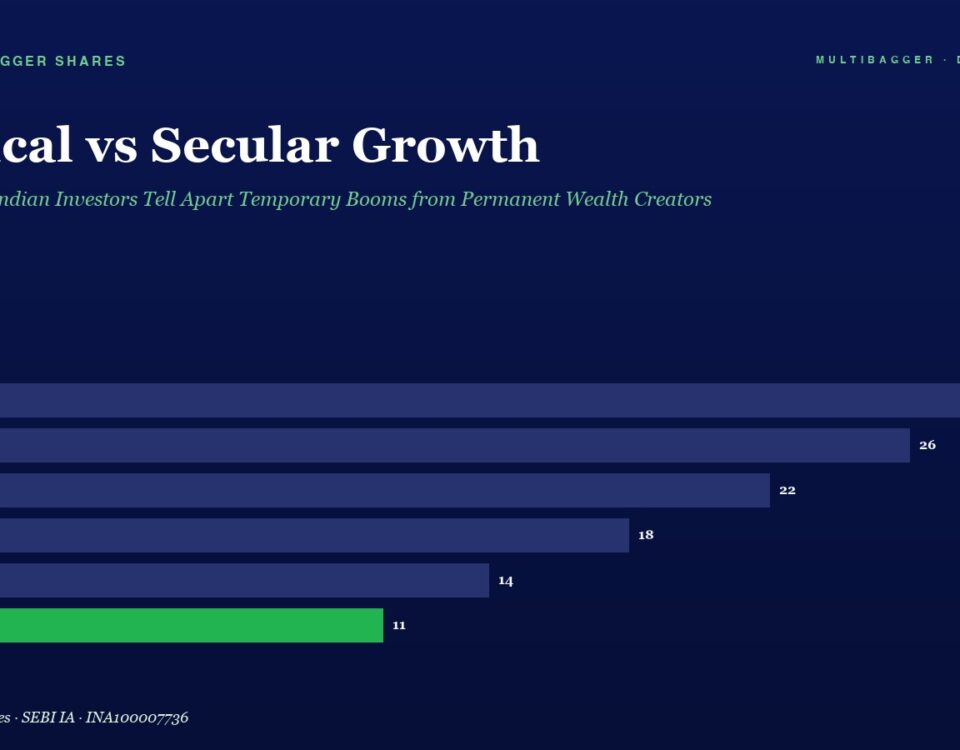
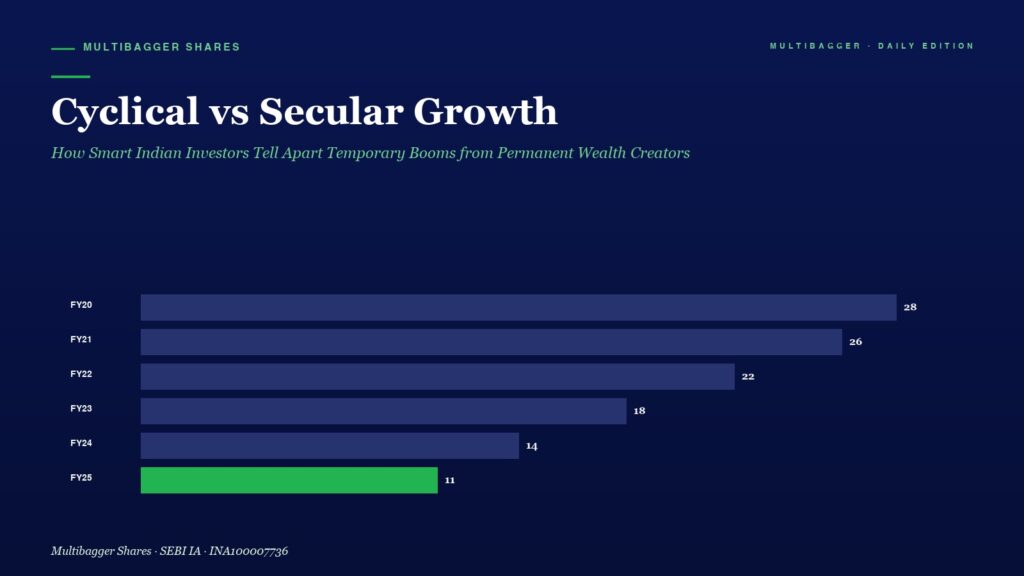
Bar chart showing yearly growth FY20–FY25; FY25 is green with value 11, other years reaching up to 28 in FY20.

Cyclical vs Secular Growth: How Smart Indian Investors Tell Apart Temporary Booms from Permanent Wealth Creators

Learn how to distinguish cyclical growth from secular growth in Indian stocks — a critical skill that separates wealth creators from wealth destroyers. With Titan Biotech (₹504) case study, real Indian examples, and a practical 4-test framework.
+91-7380122211