ROCE: The King of Quality Metrics – Finding Quality Compounders in Indian Stock Market

Bar Chart Titled the Coffee Can Portfolio Showing Yearly Values Fy20fy25 28 26 22 18 14 with Fy25 Value 11 in a Green Bar Highlight
The Coffee Can Portfolio: Why Doing Nothing Can Make You Rich
March 17, 2026
Infographic Titled why Quality Stocks Never Look Cheap Showing a Horizontal Bar Chart of Fy20 to Fy25 Values Bars Decrease from 28 to 11 with Fy25 Highlighted in Green
Why Quality Stocks Never Look Cheap — And Why That’s Actually a Good Sign
March 18, 2026
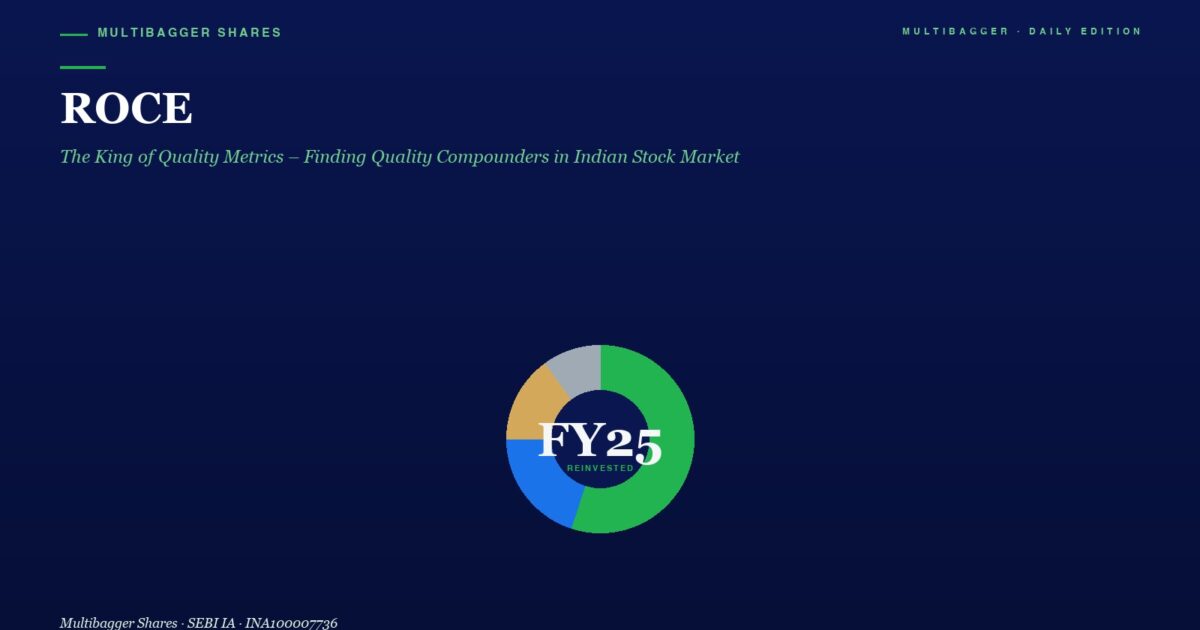
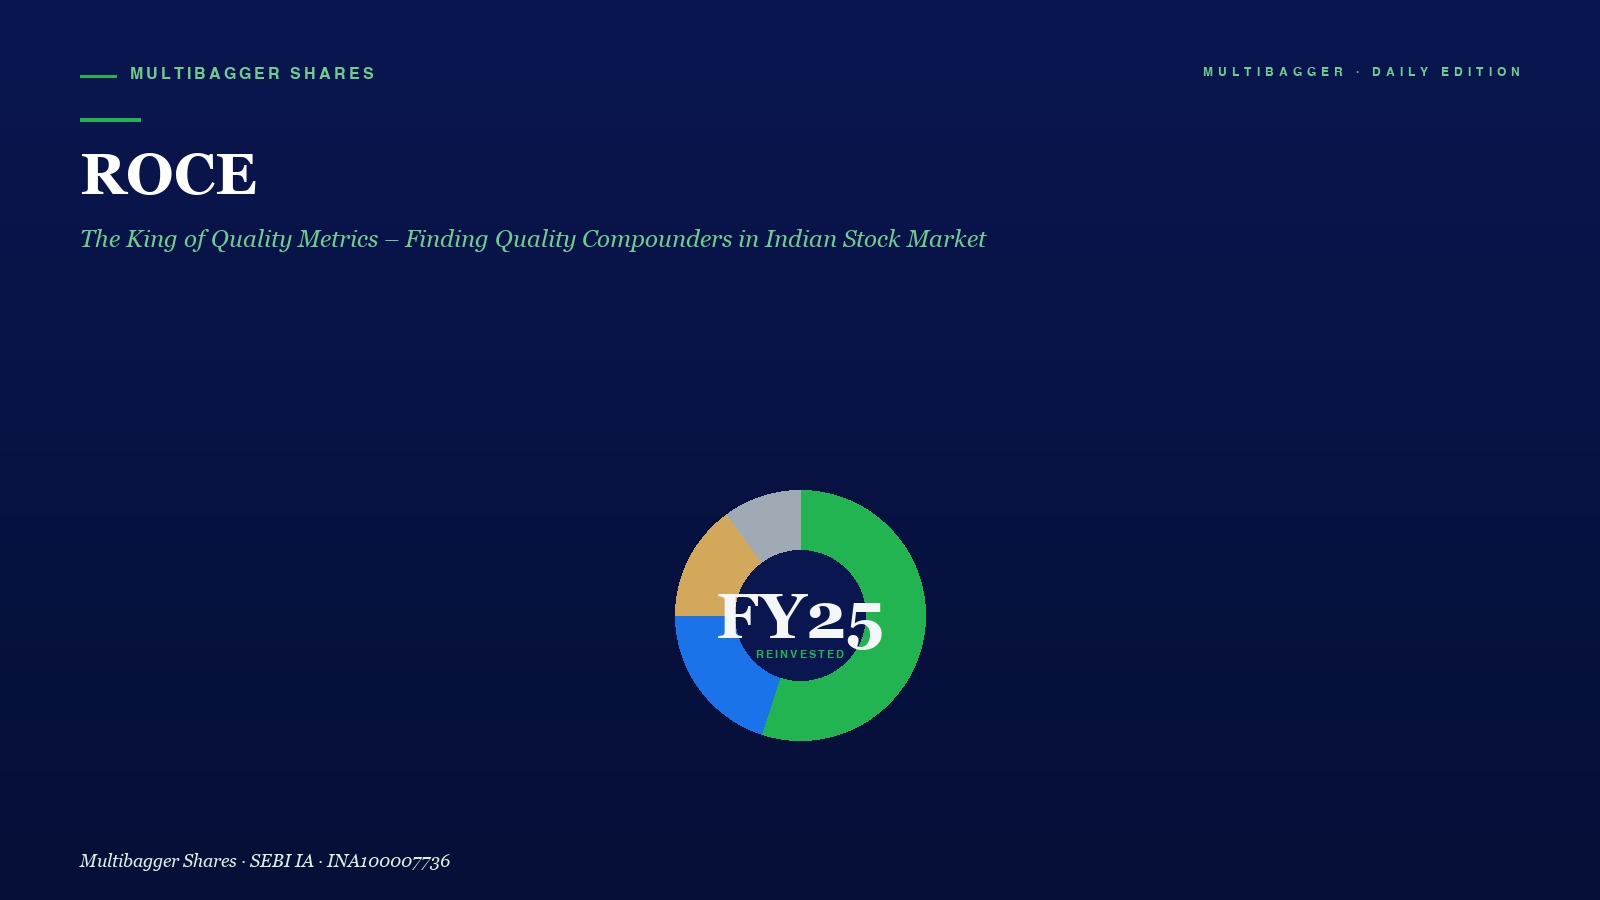
Hero Section with Roce Title and Green Subtitle on a Deep Blue Gradient a Multicolor Donut Chart Labeled Fy25 Reinvested Sits in the Center

#image_title

VALUE INVESTING · BLOG

ROCE: The King of Quality Metrics – Finding Quality Compounders in Indian Stock Market

← ALL ARTICLES
Mbcover Roce The King Of Quality Metri - Manish Goel Portfolio Management Service
📅 Published
March 18, 2026 (Wednesday)

ROCE: The King of Quality Metrics in Value Investing

Return on Capital Employed (ROCE) is one of the most powerful metrics for identifying quality businesses. It measures how efficiently a company generates profits from its total capital — both equity and debt.

What is ROCE?

ROCE = EBIT / Capital Employed

Where Capital Employed = Total Assets – Current Liabilities

Why ROCE Matters More Than ROE

Unlike ROE, which only considers equity and can be inflated by high debt, ROCE accounts for all capital employed in the business. This gives investors a true picture of capital efficiency.

Case Study: Titan Biotech Ltd

Titan Biotech has shown an impressive ROCE trajectory:
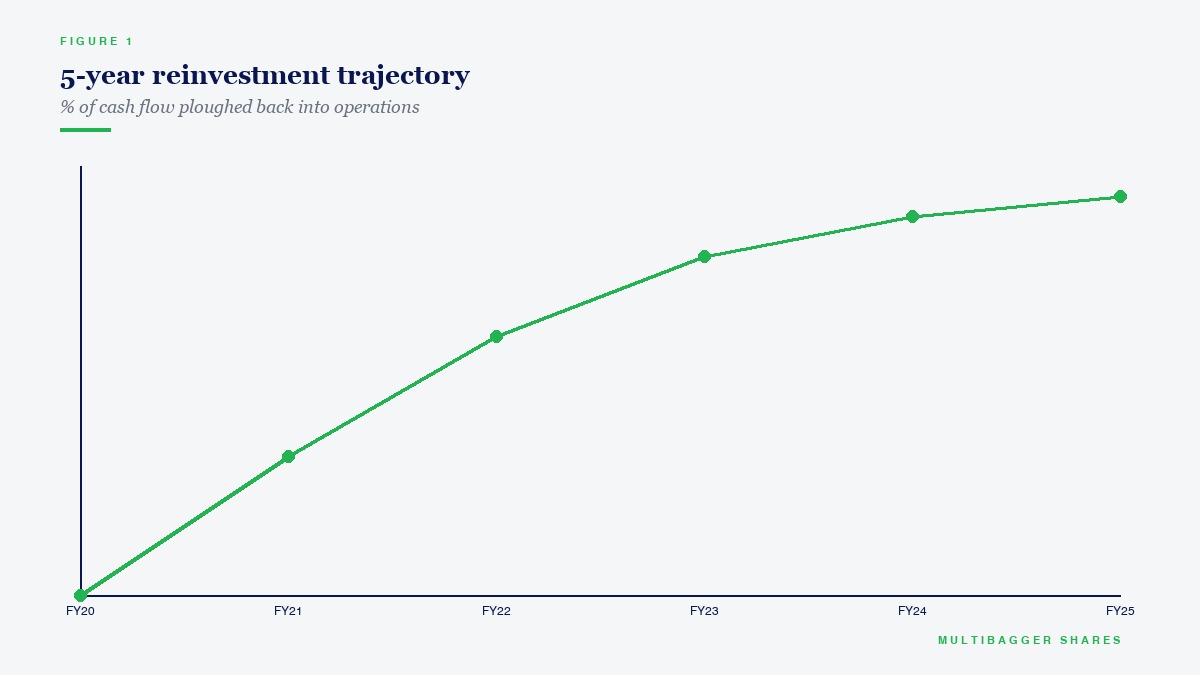
5-year reinvestment trajectory
Figure 1. 5-year reinvestment trajectory — % of cash flow ploughed back into operations
  • 2020: ~18% ROCE
  • 2022: ~22% ROCE
  • 2024: 25%+ ROCE (Excellent)

This consistent improvement signals strong management and competitive advantages.

ROCE Benchmarks

  • Below 10%: Poor
  • 10-15%: Average
  • 15-25%: Good
  • Above 25%: Excellent

Watch Our Videos

English – Quick Insight (Short)

English – Deep Dive (Long)

Hindi – Quick Insight (Short)

Hindi – Complete Guide (Long)


Manish Goel | Manish Goel (INH100004775)
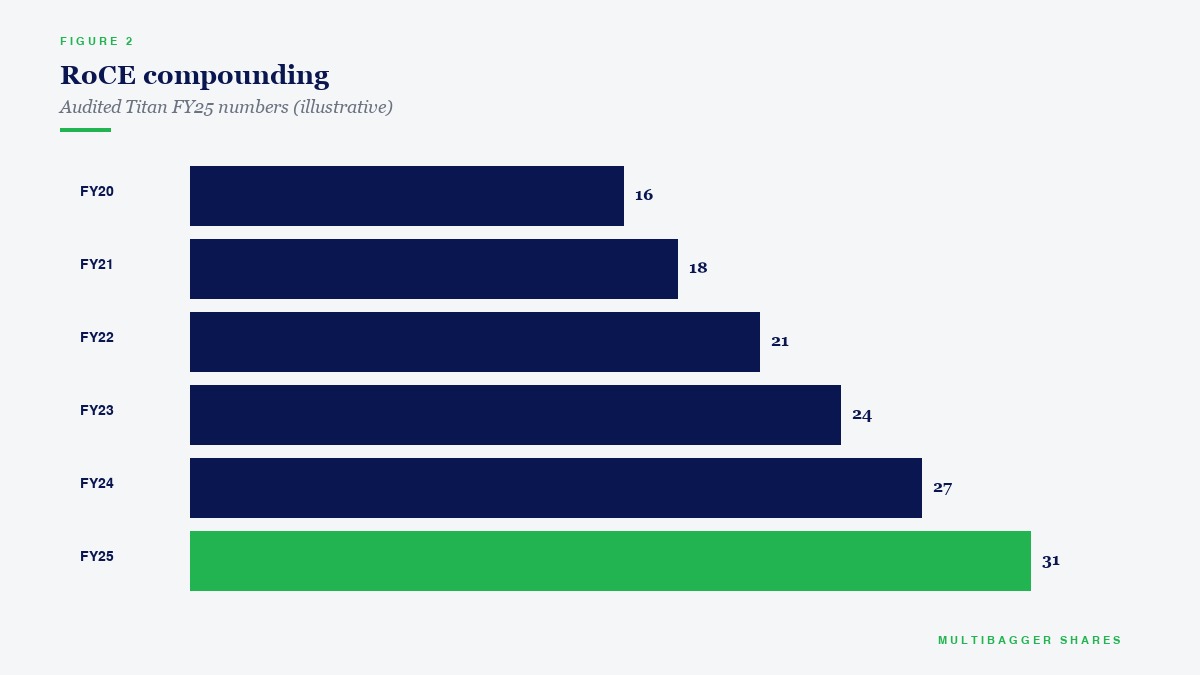
RoCE compounding
Figure 2. RoCE compounding — Audited Titan FY25 numbers (illustrative)

Visit: manishgoelpms.com

For educational purposes only. Not investment advice.

#valueinvesting #multibagger #indianstockmarket #ROCE #fundamentalanalysis

📢 Join Our Telegram Channel

Get daily value investing lessons, stock analysis & Titan Biotech updates — delivered straight to your phone!

✈️ Join @longtermequityy on Telegram

🔔 Free • No spam • Value investing insights daily

MG Manish Goel Portfolio Management Service
SEBI Registered Research Analyst · Registration No. INH100004775 · Principal Officer: Manish Goel · 2209, Sector 63, Chandigarh — 160047, India
Investments are subject to market risks. Past performance is not indicative of future returns. Please read all documents carefully.
© 2026 Manish Goel Portfolio Management Service. All rights reserved. · Privacy · Disclaimer
author avatar
Manish Goel
Manish Goel is a Chartered Accountant, SEBI Registered Research Analyst, and founder of Manish Goel PMS. A full-time value investor since 2010, he has helped thousands of investors build long-term wealth through quality stock picking and disciplined fundamental analysis.
+91-7380122211