Behavioral Finance

May 14, 2026
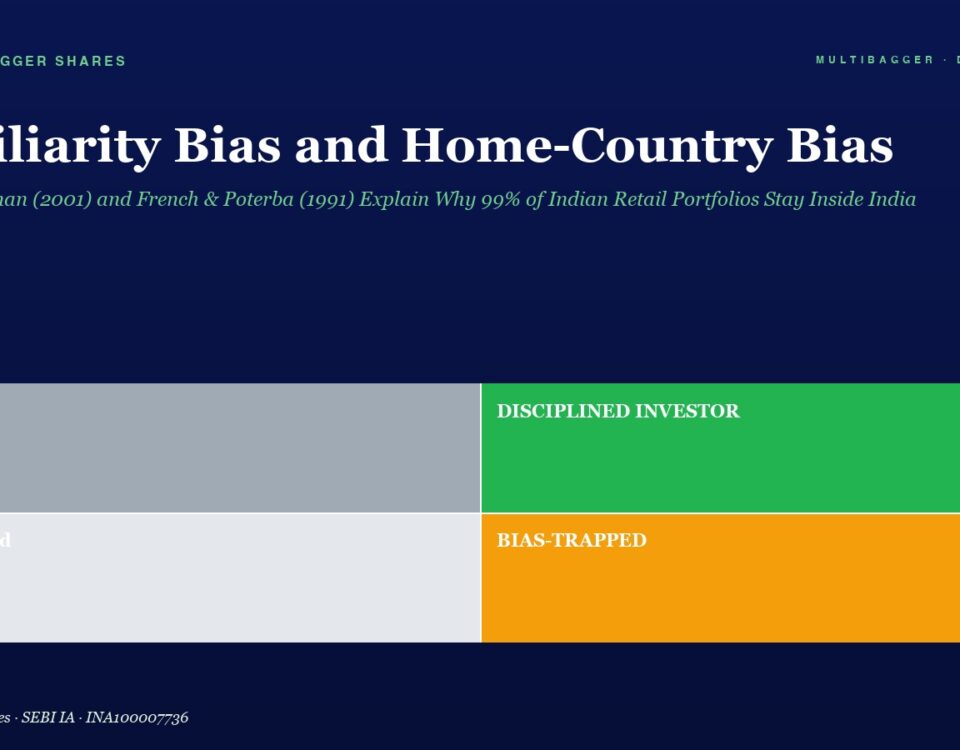
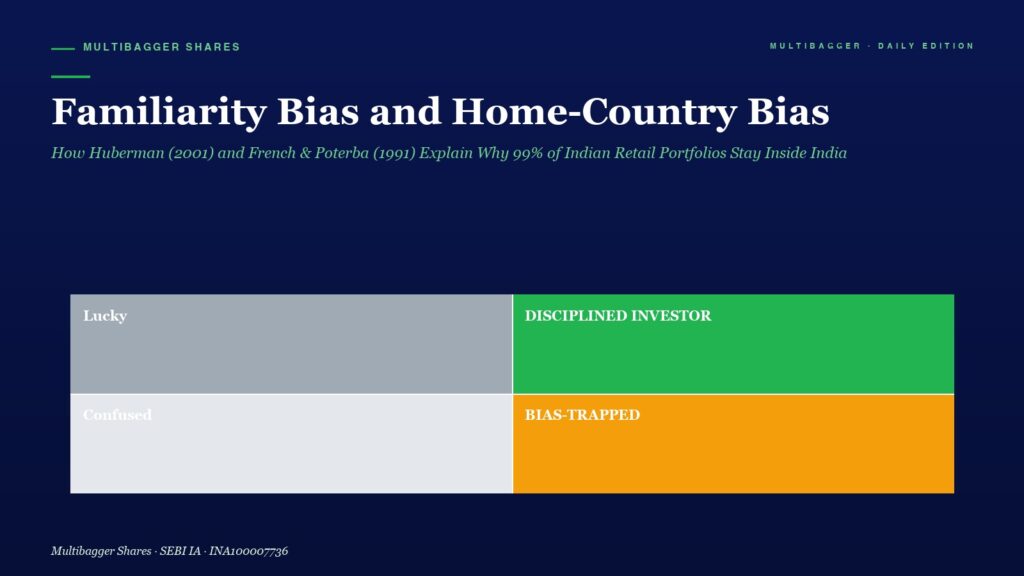
Infographic titled 'Familiarity Bias and Home-Country Bias' showing four colored blocks: left column gray labeled 'Lucky' (top) and 'Confused' (bottom); right column green top labeled 'DISCIPLINED INVESTOR' and orange bottom labeled 'BIAS-TRAPPED', illustrating four states of investor bias.

Familiarity Bias and Home-Country Bias: How Huberman (2001) and French & Poterba (1991) Explain Why 99% of Indian Retail Portfolios Stay Inside India

Familiarity Bias — Huberman 2001, French & Poterba 1991, Coval & Moskowitz 1999 — explains why 99% of Indian retail portfolios stay inside India. Titan Biotech's 34.5% FY25 export revenue mix is the corporate anti-bias illustration.
May 14, 2026
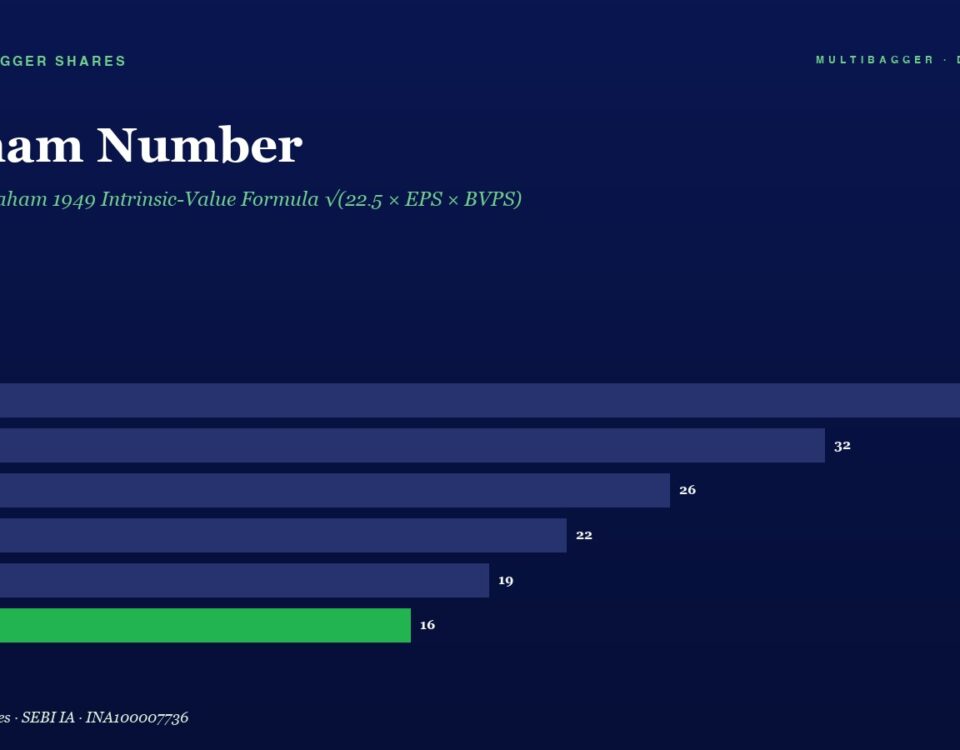
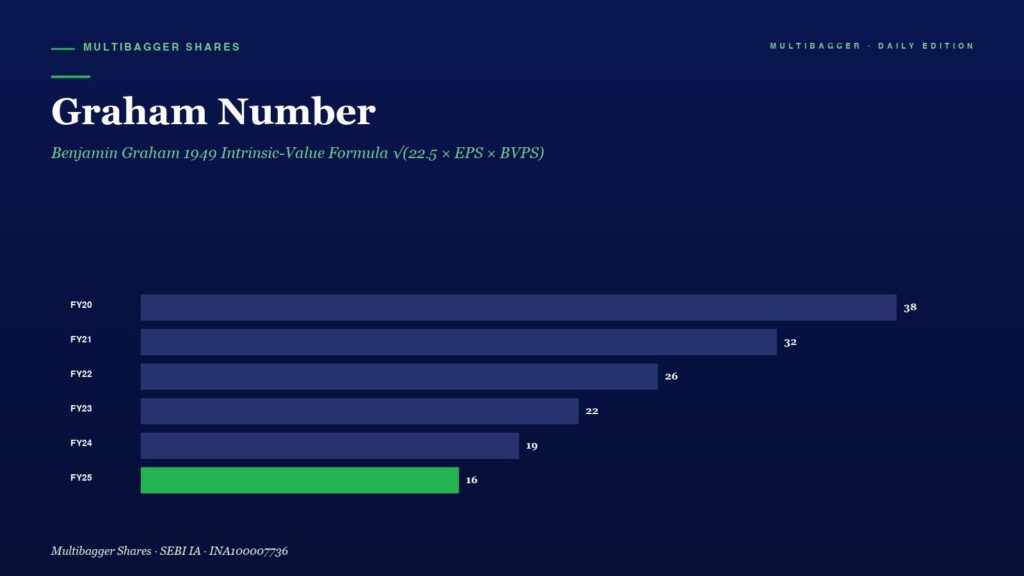
Graham Number bar chart from FY20 to FY25 showing values 38, 32, 26, 22, 19, 16 with a dark blue background and green highlight for FY25.

Graham Number: Benjamin Graham 1949 Intrinsic-Value Formula √(22.5 × EPS × BVPS)

Benjamin Graham 1949 intrinsic-value formula explained. How Indian investors should compute and read √(22.5 × EPS × BVPS), Graham seven defensive screens, and Titan Biotech FY25 audited markers as a positive illustration. Educational only.
May 14, 2026
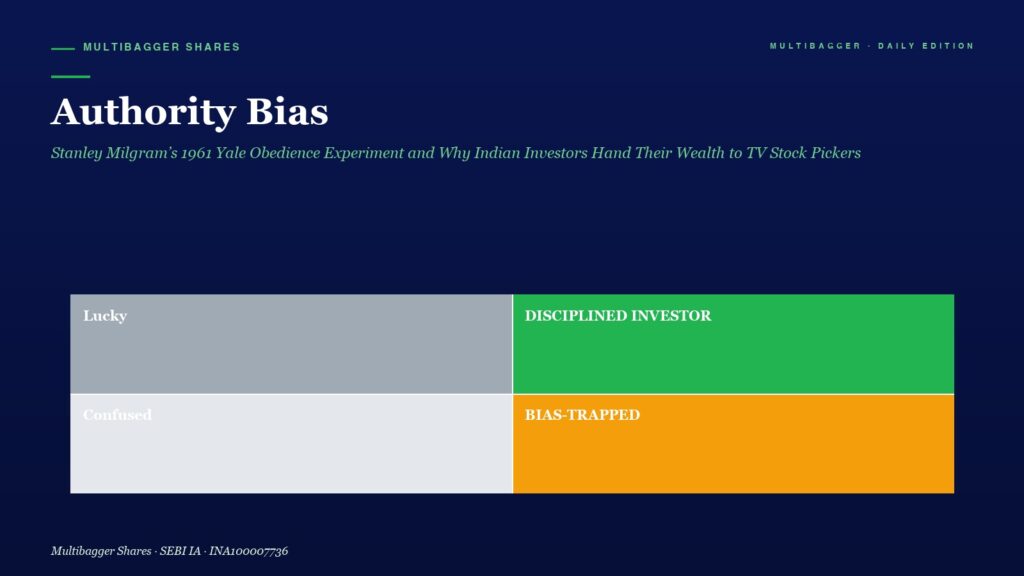
Hero header: title 'Authority Bias' with subtitle, plus a 2x2 color grid: top-left 'Lucky' (gray), top-right 'DISCIPLINED INVESTOR' (green), bottom-left 'Confused' (light gray), bottom-right 'BIAS-TRAPPED' (orange).

Authority Bias: Stanley Milgram’s 1961 Yale Obedience Experiment and Why Indian Investors Hand Their Wealth to TV Stock Pickers

Stanley Milgram’s 1961 Yale obedience study found 65% of ordinary people will electrocute a stranger because a man in a lab coat says so. The same wiring drives Indian investors to obey TV pundits and stock tipsters — and Titan Biotech’s FY25 audited numbers show what arithmetic-led investing looks like instead.
May 13, 2026
Hero section with dark blue background and the title 'Hyperbolic Discounting' plus subtitle; below, a four-block infographic labeled Lucky, DISCIPLINED INVESTOR, Confused, and BIAS-TRAPPED in gray, green, light gray, and orange.

Hyperbolic Discounting: Strotz (1956) & Laibson’s (1997) Bias Behind Why Indian SIP Investors Quit at Month 21

Strotz 1956 and Laibson 1997 formalised the bias behind 74% SIP discontinuance ratios; Titan Biotech FY25 numbers illustrate the corporate mirror image.
+91-7380122211