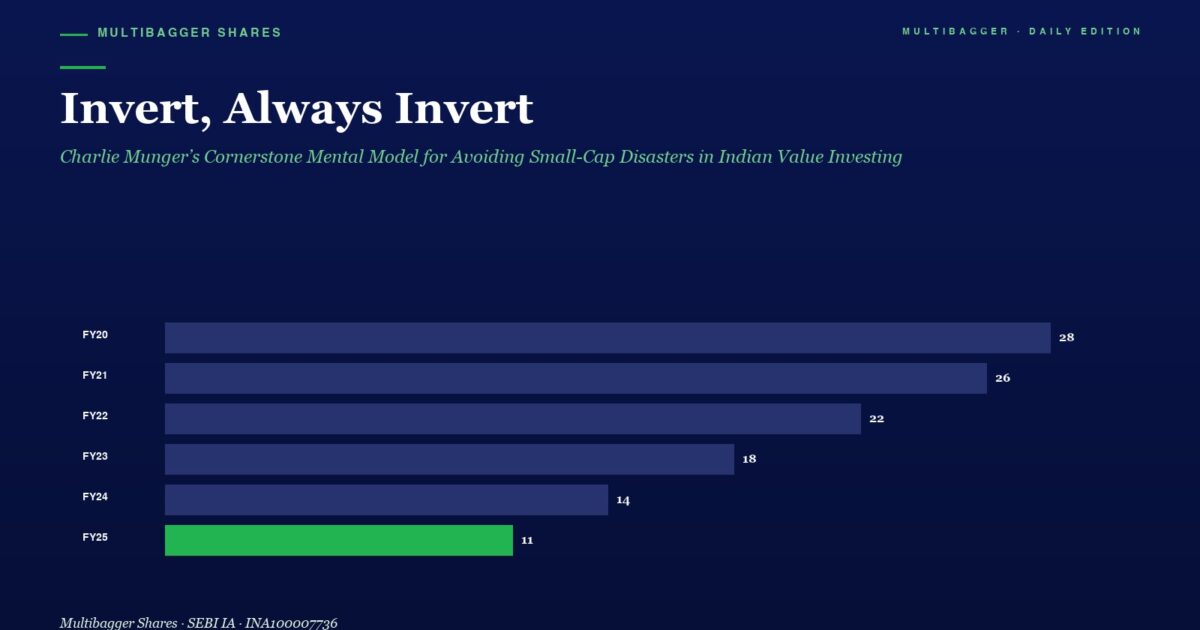
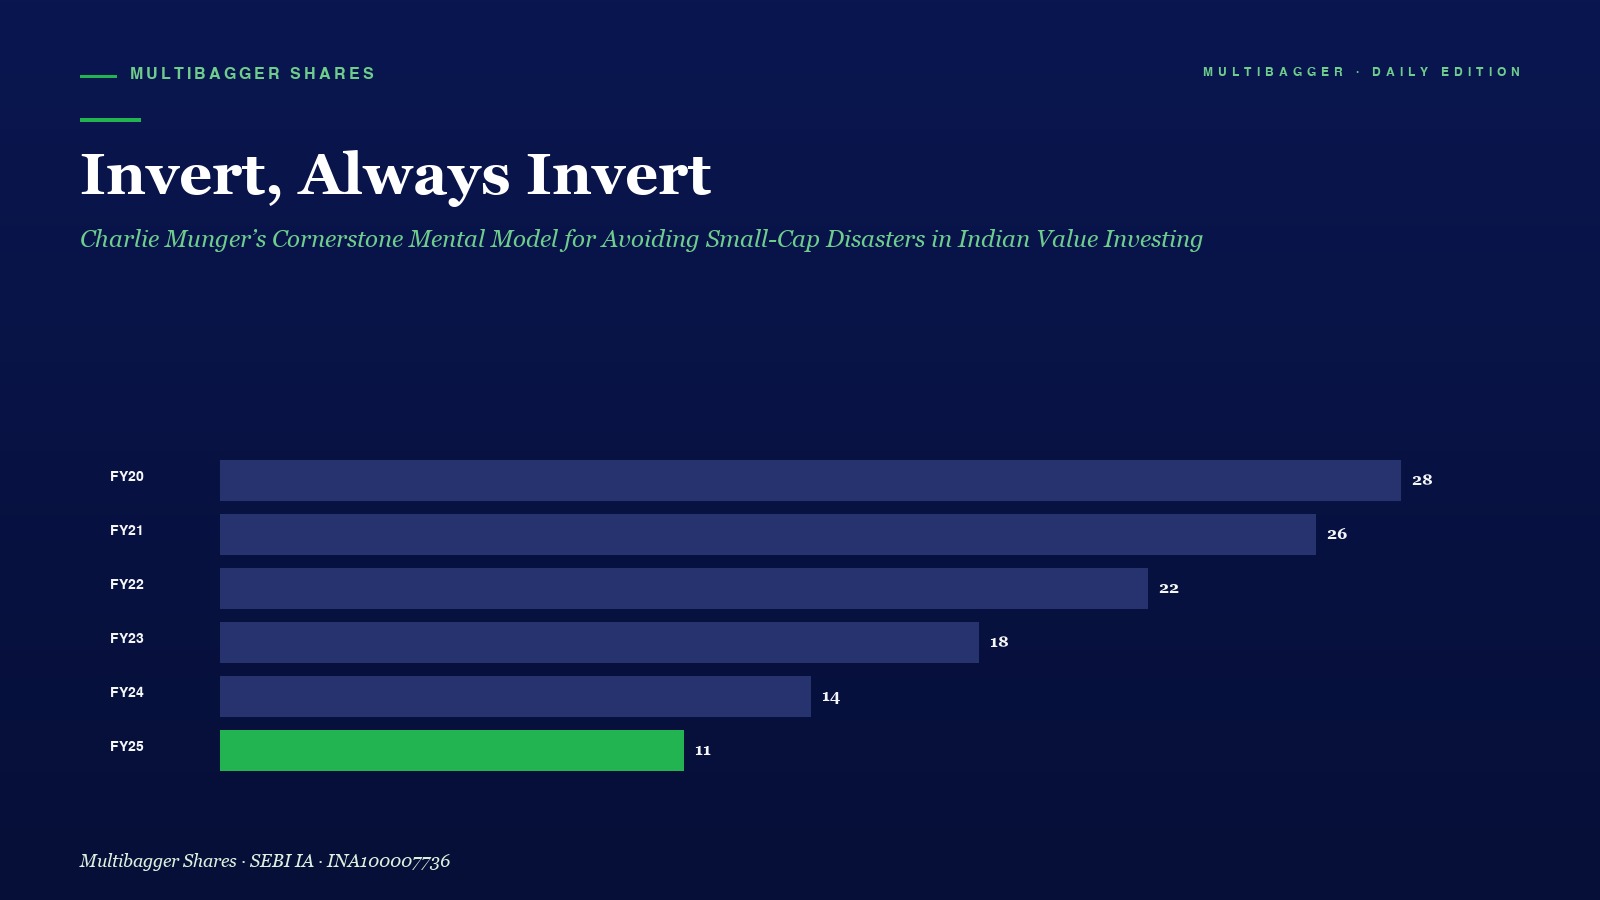
The most useful question a value investor can ask is not “how do I get rich?” It is the exact opposite: “how do I make absolutely certain I will go broke?” Stare at that second question long enough and a strange thing happens. The avoidance list that emerges — never use leverage, never bet on stories you cannot verify, never trust earnings that are not backed by cash — quietly becomes the same playbook the world’s great compounders have been using for seventy years. Charlie Munger built a life around this single trick. He called it Inversion. And I am convinced that for Indian investors in 2026 — a market full of fifteen-minute experts, hot tips on WhatsApp, and F&O accounts that double in a week and halve in three — Inversion is the single most underused mental tool on Dalal Street.
Invert, Always Invert — Jacobi’s Trick That Munger Turned Into a Fortune
The idea did not start in Omaha. It started in 19th-century Königsberg with the German mathematician Carl Gustav Jacob Jacobi, whose favourite instruction to struggling students was “Man muss immer umkehren” — one must always invert. If you cannot solve a problem in its forward form, flip it. Ask the inverse question. The answer often falls out.
Munger lifted Jacobi’s habit wholesale and weaponised it for investing. In his famous 1986 Harvard commencement address, he told graduates he had no idea how to make them happy — but he had a very clear list of behaviours that would guarantee a miserable life, and they simply had to do the opposite. In 2007 at USC he repeated the move for investors: “It is remarkable how much long-term advantage people like us have gotten by trying to be consistently not stupid, instead of trying to be very intelligent.”
That sentence is the essay I am writing today, compressed into twenty-two words. Most investors lose money not because they failed to find the next Titan or Bajaj Finance — they lose money because they stepped on landmines the inversion checklist would have flagged for free. Inversion is a way of reading the minefield before you walk.
The Inversion Checklist for Indian Small-Cap Investing
Let me do the flip in public. Forward question: “What makes an Indian small-cap a multibagger over ten years?” Inverse question: “What reliably destroys an Indian small-cap investor over ten years?” Sit with it for five minutes and a depressingly consistent list writes itself:
- Leverage on the balance sheet. Every small-cap disaster of the last decade — from DHFL to Reliance Home Finance to dozens of unlisted EPC and textile collapses — started with a debt-equity ratio above one and ended with a lender-driven fire-sale.
- Pledged promoter shares. When promoters pledge their own equity to margin loans, a 30% market dip can trigger forced selling that wipes out minority shareholders before anyone sees the news.
- Reported profits that cash flow will not confirm. If operating cash flow chronically trails reported PAT, the accounts are a story, not a statement.
- Promoter compensation and related-party transactions that outrun the business. Money leaking out via salaries, rents, loans to cousins, purchases from group entities — every one of these is a slow bleed that accelerates the moment the cycle turns.
- Capital that earns less than it costs. A business that keeps raising fresh equity to fund projects returning below its cost of capital is destroying shareholder value in slow motion, even while revenue grows.
- Opaque governance. No independent chair, rubber-stamp board, vanishing auditors, missing segment disclosures — a red-flag parade masquerading as routine.
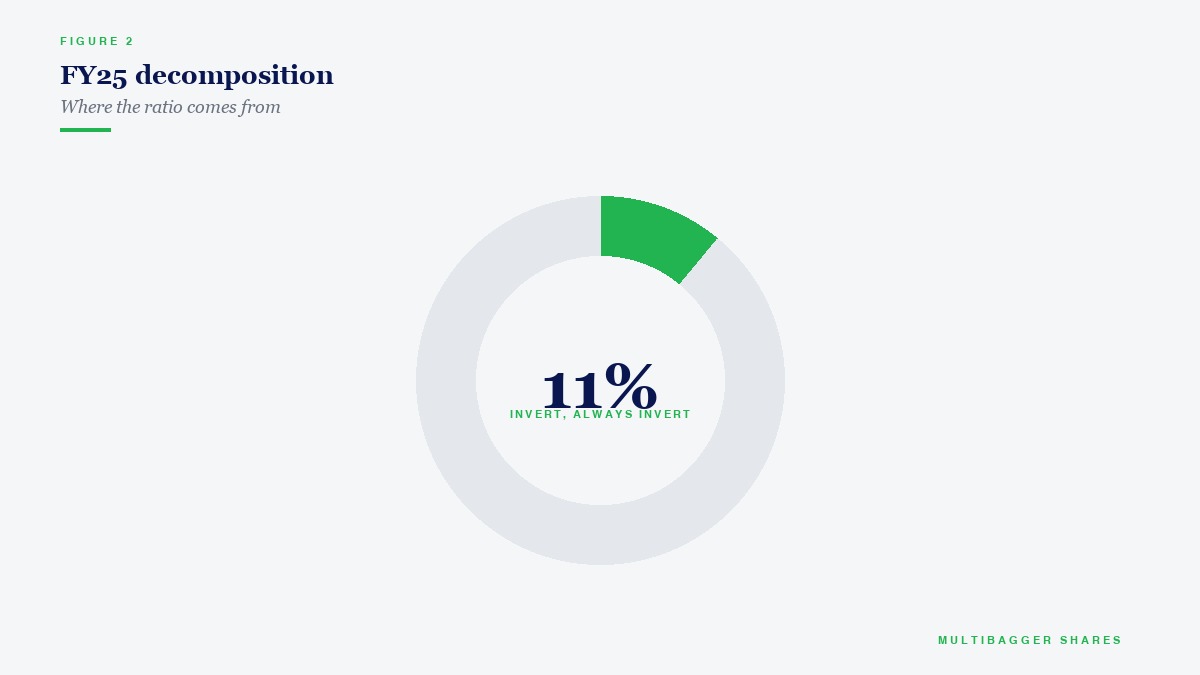
Notice what just happened. We never defined the winner. We simply listed the ways to lose, then resolved to avoid every one. That is Inversion. In my own research work, this inverse checklist filters out roughly 85% of the Indian small-cap universe in about forty minutes of reading. The remaining 15% is where forward-thinking work actually earns its keep.
How Titan Biotech’s FY25 Numbers Illustrate This Principle
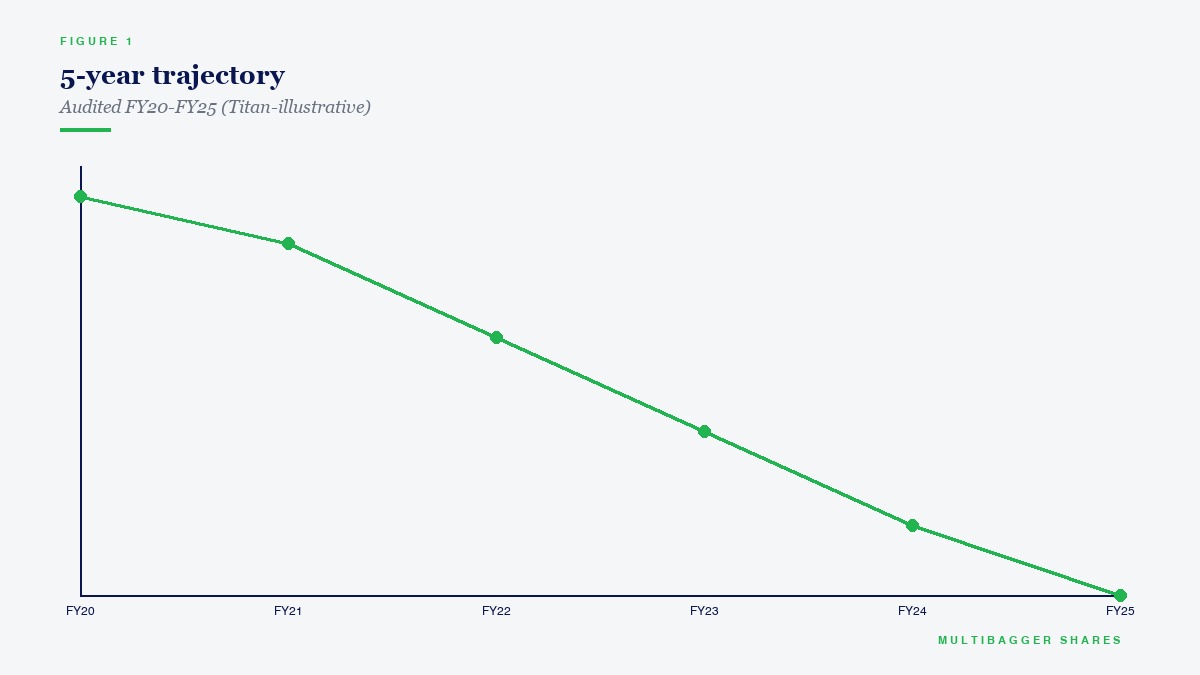
Here is where Inversion stops being philosophy and becomes something you can verify from an annual report. Take the six small-cap failure modes above and read Titan Biotech Ltd (BSE: 524717) against each, using audited FY25 numbers drawn from the company’s latest filings. What emerges is a textbook example of what a clean inversion pass looks like on paper — a board, a balance sheet and a cash-flow statement that each step around the classic failure modes rather than into them.
- Leverage — inverted away. Debt-to-equity at FY25 close sits at 0.02x, with total borrowings of roughly ₹3 crore against a net worth well over a hundred crore. Management has walked the company from a ₹53 crore net-debt position a few years ago into a comfortable net-cash footing.
- Pledged shares — inverted away. Promoter pledging stands at zero. The promoter group has not pledged a single share to raise capital, which immediately removes the forced-selling risk that has vaporised so many small-cap shareholders.
- Earnings-quality gap — inverted away. Cash flow from operations in FY25 runs at approximately 103% of operating profit. Every rupee of reported profit is showing up in the bank account; there is no phantom profitability to be quietly unwound later.
- Related-party bleed — kept under discipline. Total FY25 RPTs of around ₹24.55 crore are disclosed in detail, board-approved, at arm’s-length pricing, and cross the materiality threshold for shareholder review. The spend is visible, not buried.
- Capital efficiency — inverted into a positive. ROCE of ~16.9% comfortably clears any reasonable estimate of the cost of capital, while the company continues to fund growth from internal accruals rather than dilutive equity raises.
- Governance opacity — inverted away. An independent chair, four independent directors, and fourteen board meetings in FY25 create the kind of oversight paper trail that opaque small-caps never produce.
- Skin in the game — actively strengthened. Promoter holding has moved from 48% to 55.87% through open-market buying, the exact opposite of the “promoters quietly exiting” failure pattern.
- Cash culture. A 14-year unbroken dividend track record and a cash-and-investments pile of roughly ₹38 crore show a business that generates more cash than it needs, year after year, rather than one that perpetually needs more cash than it generates.
- Hidden-liability check. Contingent liabilities of ₹7.78 crore — about 5% of net worth — leave the balance sheet clean of the kind of off-book surprises that destroy shareholder value overnight.
That is nine data points, each one the mirror image of a classic small-cap failure mode. The company’s audited numbers clear every item on the inverse checklist without needing a footnote to explain an exception. That kind of clean pass is rare in Indian small-caps. When you find it, you stop asking “is this a ten-bagger?” and start asking the only question Munger ever cared about: “is there any plausible path to a zero from here?” For a debt-free, zero-pledged, cash-funded, dividend-paying compounder with 55.87% promoter skin in the game, Inversion suggests the answer is, mercifully, no.
The Takeaway — Do the Flip Every Monday Morning
Here is the discipline I want you to adopt this week. Before you add any new position, write down in your own handwriting the six inverse questions above and answer each one in a single line for the company in front of you. If four or more answers are uncomfortable, close the tab, thank Jacobi and Munger for the forty minutes they just saved you, and go read an annual report of something cleaner. You will be shocked how much of the Indian small-cap universe fails this one-page test — and how much calmer your portfolio becomes once the obvious losers stop entering it in the first place.
Munger used to say his entire edge boiled down to “try never to be stupid, and have a long-term horizon.” Inversion is simply the tool he used to define “stupid” precisely enough that he could see it coming. Borrow the tool. It costs nothing. It will earn back its price in the first mine it helps you walk around.
— Manish Goel / SEBI Registered Research Analyst (INH100004775) / SEBI Registered Research Analyst (INH100004775)
Disclaimer (SEBI compliance): This post is issued for educational purposes only by Manish Goel It does not constitute an offer, solicitation, or personalised recommendation to buy or sell any security. Past performance is not indicative of future results. Any specific company references, including Titan Biotech Ltd (BSE: 524717), are used as illustrative examples of corporate financial discipline and must not be construed as a view on price or future returns. The author, Manish Goel, its employees, and clients may or may not hold positions in any security mentioned. Please consult your own SEBI-registered research analyst or investment advisor and conduct independent due diligence before making any investment decision. Manish Goel is registered with SEBI as a Research Analyst (INH100004775) and Investment Advisor (INH100004775).