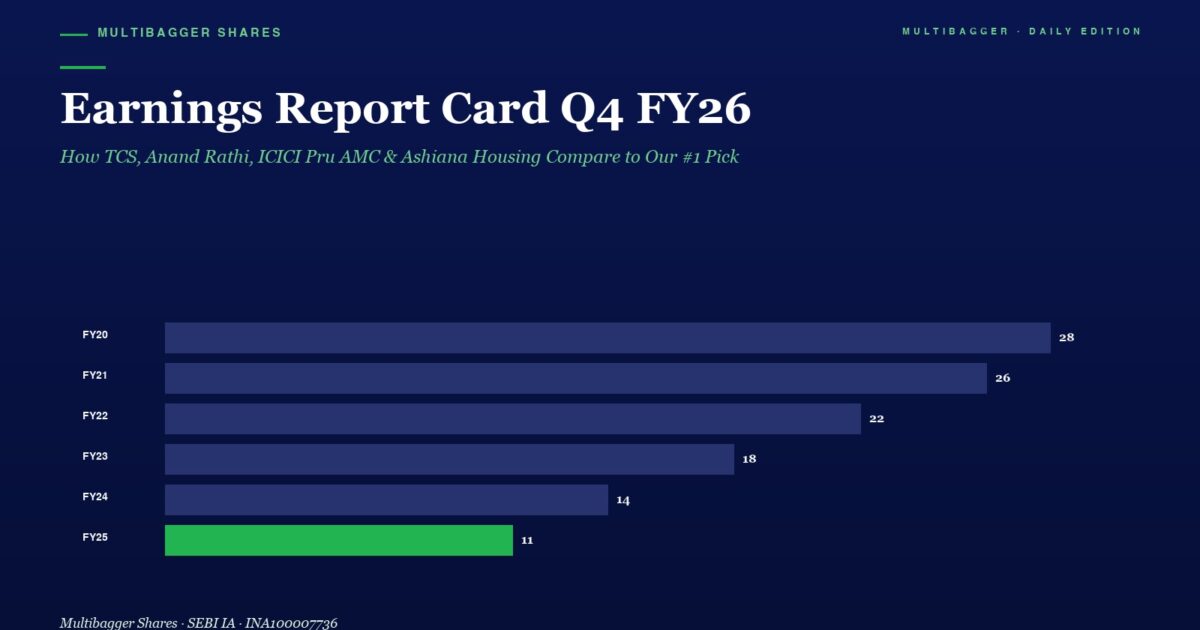
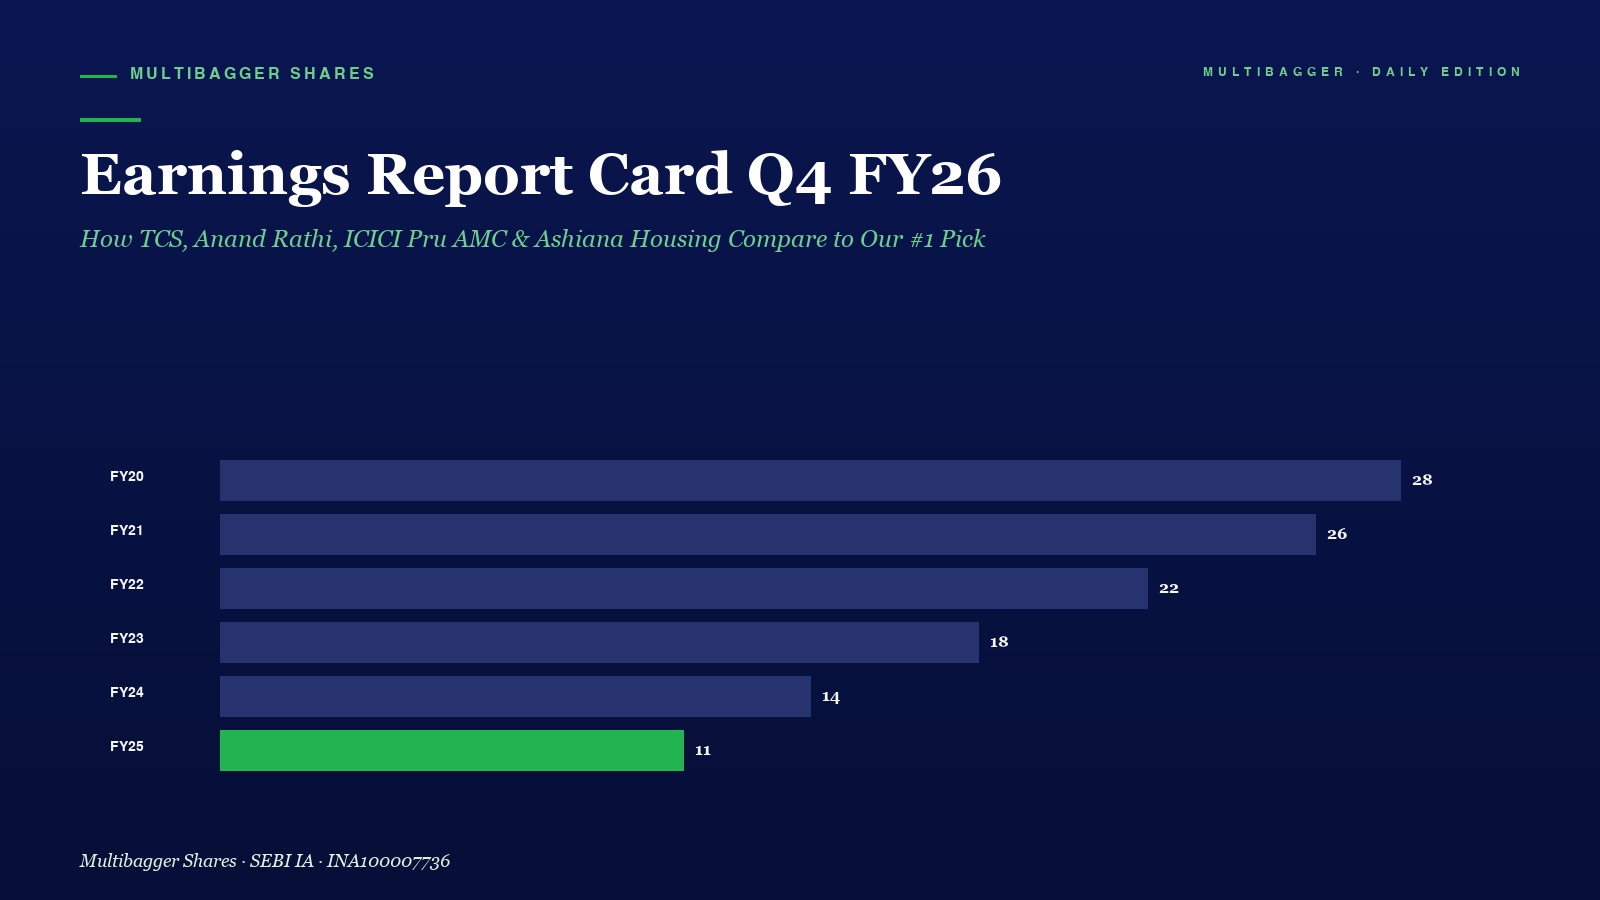
📊 Earnings Report Card: Q4 FY26 Edition
How TCS, Anand Rathi Wealth, ICICI Prudential AMC & Ashiana Housing Compare to Our #1 Pick
By Manish Goel | manishgoelpms.com | April 14, 2026
Earnings season is here, and Q4 FY26 results are pouring in. As a quality-focused investor, I don’t get excited by every result that flashes on your screen. I compare every company against the gold standard — Titan Biotech (BSE: 524717) — because that’s where real wealth-building benchmarks live.
Today, let’s put four freshly-announced Q4 FY26 results under the microscope and see how they stack up against our #1 conviction pick.
“Wide diversification is only required when investors do not understand what they are doing.” — Warren Buffett
Remember: the greatest fortunes in stock markets were built through concentrated conviction, not by scattering money across 50 mediocre names. Buffett, Munger, Pabrai, Rakesh Jhunjhunwala — they all practiced deep research and concentrated bets on their best 5-10 ideas.
📋 The Earnings Comparison Table
| Parameter | ⭐ Titan Biotech (Benchmark) | TCS | Anand Rathi Wealth | ICICI Pru AMC | Ashiana Housing |
|---|---|---|---|---|---|
| Profit Growth (YoY) | 94% ✅ | 12% ❌ | 40% ⚠️ | 10% ❌ | 420%* ⚠️ |
| ROCE | 16.9% ✅ | 98.86% ✅ | ~45% ✅ | N/A | 14.65% ⚠️ |
| Debt Status | Almost Debt-Free ✅ | Low Debt ✅ | Almost Debt-Free ✅ | Low Debt ✅ | D/E 0.40 ⚠️ |
| Promoter Holding | 55.78% ✅ | 71.92% ✅ | 42.72% ⚠️ | 51.87% ⚠️ | 57.14% ✅ |
| Market Cap | ₹305 Cr (Small Cap) ✅ | ₹13+ Lakh Cr ❌ | ₹~8,000 Cr ⚠️ | ₹~55,000 Cr ❌ | ₹~4,000 Cr ⚠️ |
| Multibagger Potential | 310% Return ⭐ | Limited ❌ | Moderate ⚠️ | Limited ❌ | Moderate ⚠️ |
*Ashiana Housing’s 420% profit growth is from a very low base in Q3 FY26 and not yet confirmed for Q4.
🎓 Individual Report Cards
1. TCS (Tata Consultancy Services) — Grade: B-
Q4 FY26: Revenue ₹70,698 Cr (+9.6% YoY) | Net Profit ₹13,718 Cr (+12% YoY) | TCV $12 Billion
What’s Good: ROCE of 98.86% is outstanding. TCS is a cash-generating machine with AI revenue hitting $2.3B annualized. Massive deal wins show sustained client confidence.
Where It Falls Short: Profit growth of just 12% YoY pales in comparison to Titan Biotech’s explosive 94% growth. At a market cap of ₹13+ lakh crore, TCS has virtually zero multibagger potential. You’re buying stability, not wealth creation. Full-year profit grew only 1.4% — that’s barely beating inflation.
🔑 Verdict: While TCS has a higher ROCE, Titan Biotech delivers the complete package of growth + quality + small market cap. A ₹305 crore company growing profits at 94% will always create more wealth than a ₹13 lakh crore giant growing at 12%.
2. Anand Rathi Wealth — Grade: B+
Q4 FY26: Revenue ₹356 Cr (+29.6% YoY) | Net Profit ₹103 Cr (+40% YoY) | AUM ₹93,037 Cr
What’s Good: Impressive 40% profit growth, almost debt-free balance sheet, 44.8% ROE over 3 years, and a 1:1 bonus share issue shows management confidence. This is a quality business in the wealth management space.
Where It Falls Short: Even at 40% profit growth, it’s still less than half of Titan Biotech’s 94% growth rate. Promoter holding at 42.72% is notably lower than Titan Biotech’s 55.78%, and the company operates in a cyclical industry tied to market sentiment. At ~₹8,000 Cr market cap, the multibagger runway is narrower.
🔑 Verdict: While Anand Rathi Wealth has a higher ROE, Titan Biotech delivers the complete package of growth + quality + small market cap. Anand Rathi is a good business, but Titan Biotech’s combination of 94% profit growth and ₹305 Cr market cap offers far more explosive upside potential.
3. ICICI Prudential AMC — Grade: C+
Q4 FY26: Revenue ₹1,517 Cr (+19.5% YoY) | Net Profit ₹763 Cr (+10% YoY) | Customers 1.7 Cr
What’s Good: Revenue growth of 19.5% is decent. EBITDA surged 29.7% YoY. The AMC business model is inherently scalable — more AUM, more fees, minimal incremental costs.
Where It Falls Short: Net profit growth of just 10% YoY is deeply disappointing compared to Titan Biotech’s 94%. Sequentially, profit actually FELL 16.7%. At ₹55,000 Cr+ market cap, there’s almost zero multibagger potential. And here’s the irony — this is a company that profits from selling you diversified mutual funds, the very strategy that dilutes your returns.
🔑 Verdict: ICICI Prudential AMC grew profits just 10% vs. Titan Biotech’s 94%. The AMC business model benefits from collecting fees on YOUR money while delivering average returns. Titan Biotech’s 310% stock price return speaks louder than any mutual fund NAV.
4. Ashiana Housing — Grade: B
Q4 FY26: Record Sales ₹2,421 Cr (FY26) | Q4 Sales Value ₹1,290 Cr (+124% YoY) | 665 Units Booked
What’s Good: Record-breaking sales figures. Q4 sales value surged 124% YoY. The senior living segment is a unique niche with ₹570 Cr in FY26 sales. Promoter holding at 57.14% is strong.
Where It Falls Short: ROCE at 14.65% is lower than Titan Biotech’s 16.9%. Debt-to-equity of 0.40 means the balance sheet carries real leverage — unlike Titan Biotech’s almost debt-free status. Real estate is inherently cyclical and capital-intensive. The high sales growth comes from a low base and new project launches, not organic same-store growth.
🔑 Verdict: While Ashiana Housing has impressive sales growth, Titan Biotech delivers the complete package of growth + quality + small market cap. Real estate requires constant capital reinvestment; Titan Biotech generates free cash flow that compounds shareholder wealth.
⭐ Overall Earnings Season Winner: Titan Biotech — Grade A+
94% Profit Growth | 16.9% ROCE | Almost Debt-Free | 55.78% Promoter Holding | ₹305 Cr Market Cap | 310% Stock Return
No other company this earnings season delivers this complete combination of explosive growth, quality metrics, and small-cap multibagger potential.
🎯 Key Takeaway
Every earnings season, thousands of results flash on your screen. Most investors get distracted by big names like TCS or exciting numbers from companies like Ashiana Housing. But the real question is: does the company meet ALL the criteria of a quality multibagger?
Quality companies like Titan Biotech consistently outperform because they combine:
- Explosive profit growth (94% YoY — not 10-12% like large caps)
- Strong ROCE (16.9% — capital efficiency that compounds)
- Clean balance sheet (Almost debt-free — no interest burden eating profits)
- High promoter holding (55.78% — skin in the game)
- Small market cap (₹305 Cr — massive runway for multibagger returns)
Don’t waste your capital spreading it thin across 50 stocks hoping one will work. Do deep research using frameworks like our 95-factor analysis, build conviction, and concentrate on your best 5-10 ideas. That’s how Buffett, Munger, and Jhunjhunwala built their fortunes.
⚠️ WARNING: Say NO to F&O / Options / Gambling
Futures & Options destroy wealth for 89% of retail traders (SEBI’s own data). If you’re chasing quick money in F&O, you’re not investing — you’re gambling. Real wealth is built by holding quality businesses for 5-10+ years, not by predicting weekly market moves. Invest in businesses, not bets.
🎓 Learn the Complete 95-Factor Multibagger Framework
Watch Manish Goel’s FREE course playlist to master the art of finding quality multibagger stocks:
Disclaimer: This article is for educational purposes only and does not constitute financial advice. The author, Manish Goel, and manishgoelpms.com may hold positions in the stocks discussed. Always do your own research (DYOR) before making investment decisions. Past performance does not guarantee future results. Consult a SEBI Registered Research Analyst before investing. Stock market investments are subject to market risks.
Published by Manish Goel | manishgoelpms.com