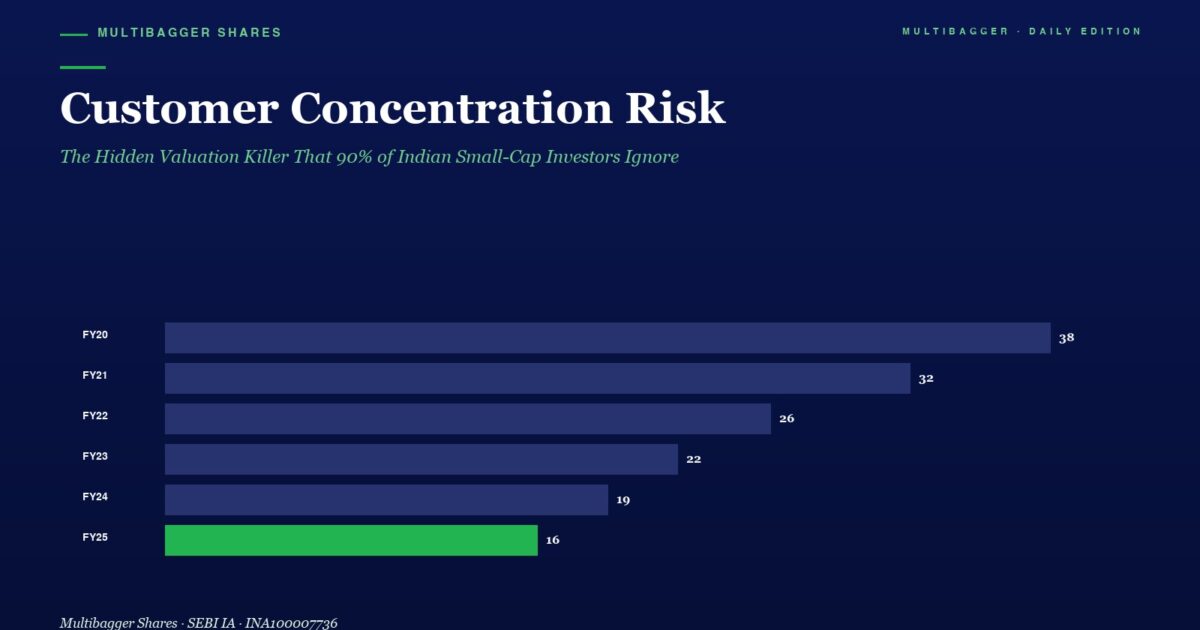
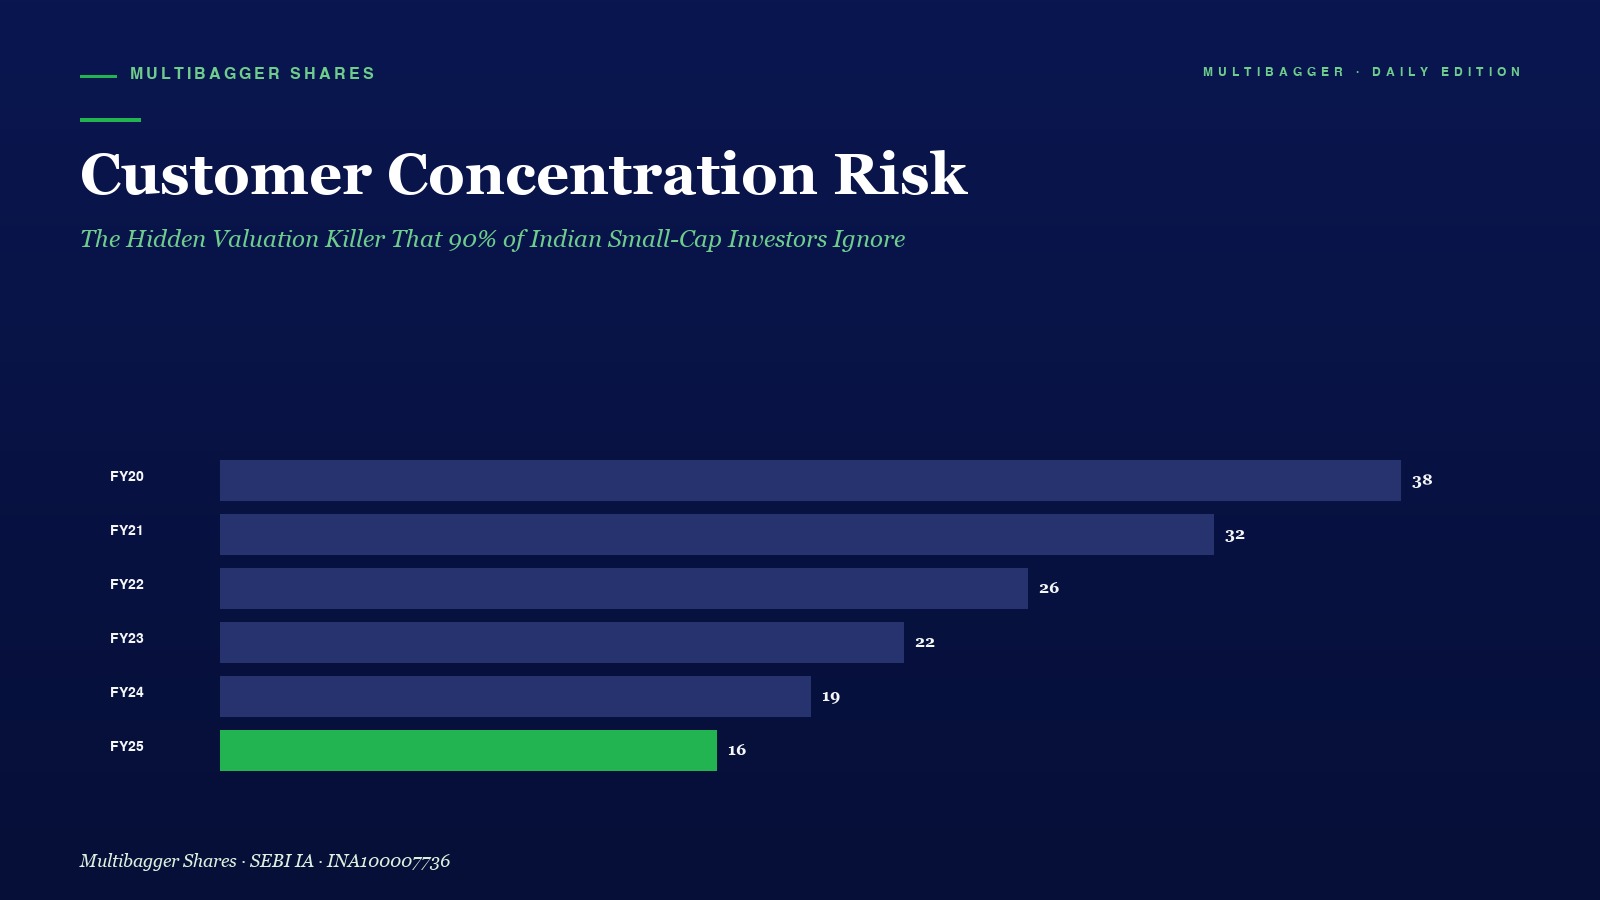
There is one question that the vast majority of Indian small-cap investors never ask when analysing a company. They check the P/E ratio. They study the promoter holding. They look at the ROCE and the debt-to-equity. But they almost never ask: what percentage of this company’s revenue comes from its single largest customer?
That one unanswered question has destroyed more small-cap portfolios than any market crash, interest rate hike, or geopolitical shock. It is called Customer Concentration Risk — and it is the hidden valuation killer that Wall Street analysts obsess over while Dalal Street retail investors barely know it exists.
In this post, we will dissect this concept completely, understand why it is so dangerous for Indian small-cap investors, learn how to measure and find it, and see why quality businesses like Titan Biotech have deliberately built their revenue structure to eliminate this exact risk.
What is Customer Concentration Risk?
Customer concentration risk is the danger that arises when a business depends on a small number of customers — or even a single customer — for a disproportionately large share of its revenue. If that customer delays payments, cancels orders, renegotiates terms, or simply finds a cheaper supplier, the company’s financials can collapse almost overnight.
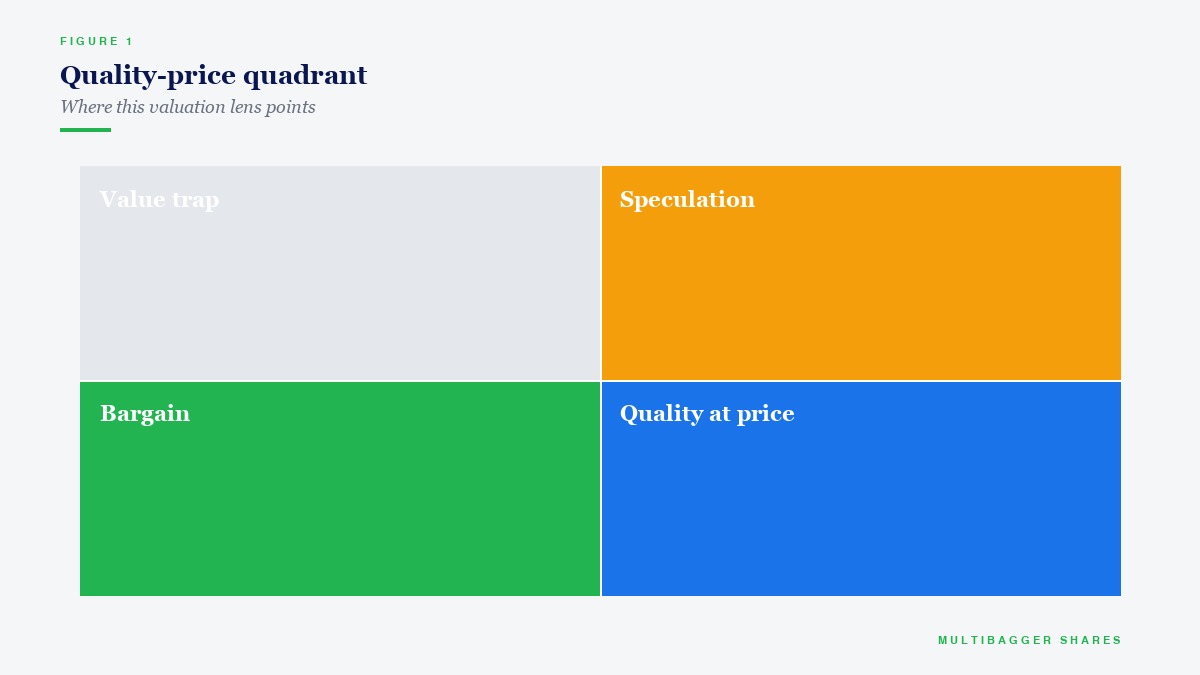
A commonly used threshold is this: if any single customer contributes more than 10% of total revenue, that is a concentration risk worth examining. If the top 5 customers together account for more than 60% of revenue, the business is structurally fragile regardless of how strong its financial ratios appear on a screener.
Think of it as a table with very few legs. It might look sturdy when everything is balanced — but remove even one leg and the entire structure collapses.
Why Indian Small-Caps Are Especially Vulnerable
In India’s small-cap and mid-cap universe, customer concentration is a far more prevalent problem than most investors realise. This happens for several structural reasons.
First, many small Indian manufacturers start their journey by winning one or two anchor clients — often large government entities, PSUs, or export buyers — who give them volume but come with an implicit threat: lose this one account and your factory runs at 30% capacity overnight.
Second, smaller companies often lack the sales infrastructure or brand equity to diversify their client base quickly. They are operationally excellent but commercially fragile.
Third, Indian promoters frequently disclose customer concentration only in the annual report’s “Notes to Accounts” section — buried under dense legal language that retail investors never read. Screeners like Screener.in and Trendlyne don’t highlight this metric. It requires active manual due diligence.
The result: an investor buys a company with a 28% operating margin and a beautiful 5-year revenue CAGR of 22%, only to watch the stock crash 50% in a single quarter when its largest client shifts its sourcing to a competing vendor.
Real-World Impact: What Customer Concentration Does to a Stock
Consider the case pattern that has played out repeatedly in Indian small-cap history. A textile ancillary manufacturer with a clean balance sheet and high margins reports stellar quarterly numbers for 12 consecutive quarters. Retail investors pile in. The stock trades at 35x earnings. Then, in a single disclosure, the company reveals that its largest client — an international retail chain — has decided to nearshore its sourcing. Revenue from that client was 38% of total. The stock falls 65% in three months. The fundamentals didn’t change overnight. The concentration risk was always there. Nobody was looking.
Similarly, an IT services company in the mid-cap space once had 47% of its revenue coming from one US financial services firm. When that firm was acquired and the acquirer renegotiated all vendor contracts at steep discounts, the mid-cap’s earnings collapsed by 40% in a single year.
The lesson is identical in every case: the concentration risk was always in the annual report. Most investors simply never looked.
How to Measure Customer Concentration: Practical Tools
1. The Annual Report’s “Significant Customer” Disclosure: SEBI and the Companies Act require Indian listed companies to disclose customers contributing more than 10% of revenue. This is typically found in the Notes to Financial Statements or the MD&A section. Always read the last three annual reports and compare year-over-year. Is the dependency increasing or decreasing?
2. Segment Revenue Breakdown: If a company has a single segment serving one or two industries, any sectoral downturn automatically creates a concentration event at the industry level. Geographic concentration (all revenue from one country) is equally dangerous.
3. The Herfindahl-Hirschman Index (HHI) for Revenue: Sophisticated analysts apply HHI to customer revenue breakdowns. If you have customer-wise revenue percentages, a score above 2,500 indicates high concentration. This is the same formula competition regulators use to assess monopoly risk — applied to your portfolio.
4. Debtors Concentration in Receivables Notes: If one party accounts for 40%+ of trade receivables, that is a direct proxy for customer concentration. High debtor concentration paired with rising Debtors Days Outstanding (DDO) is a red flag of the highest order.
5. Management Interviews and AGM Transcripts: Promoters often discuss their largest relationships in AGM proceedings. Note when a company says “our relationship with X continues to be strong” in every call — it is often code for “X is our single largest revenue source.”
Titan Biotech’s Geographic Diversification Fortress
This is where Titan Biotech Ltd (BSE: 524717) teaches a masterclass in how quality businesses are built. While most Indian small-caps struggle with customer concentration, Titan Biotech has systematically done the opposite.
As of FY2025, Titan Biotech exports its products to more than 100 countries. This extraordinary geographic diversification means that no single country — let alone a single customer — can meaningfully disrupt the company’s revenue stream. If demand softens in one market due to currency fluctuation, regulatory changes, or geopolitical friction, the other 99+ markets continue generating revenue.
Titan Biotech earns approximately 34.5% of its total revenue from exports. The remaining domestic revenue is spread across multiple industries — pharmaceuticals, food, dairy, diagnostics, cosmetics, and research — further reducing the chance that any single customer or industry can cause a catastrophic revenue decline.
Consider the contrast: a typical small-cap contract manufacturer may have 3 domestic clients contributing 70% of revenues. Titan Biotech has 100+ international markets plus a diversified domestic base. The structural risk profiles are incomparably different.
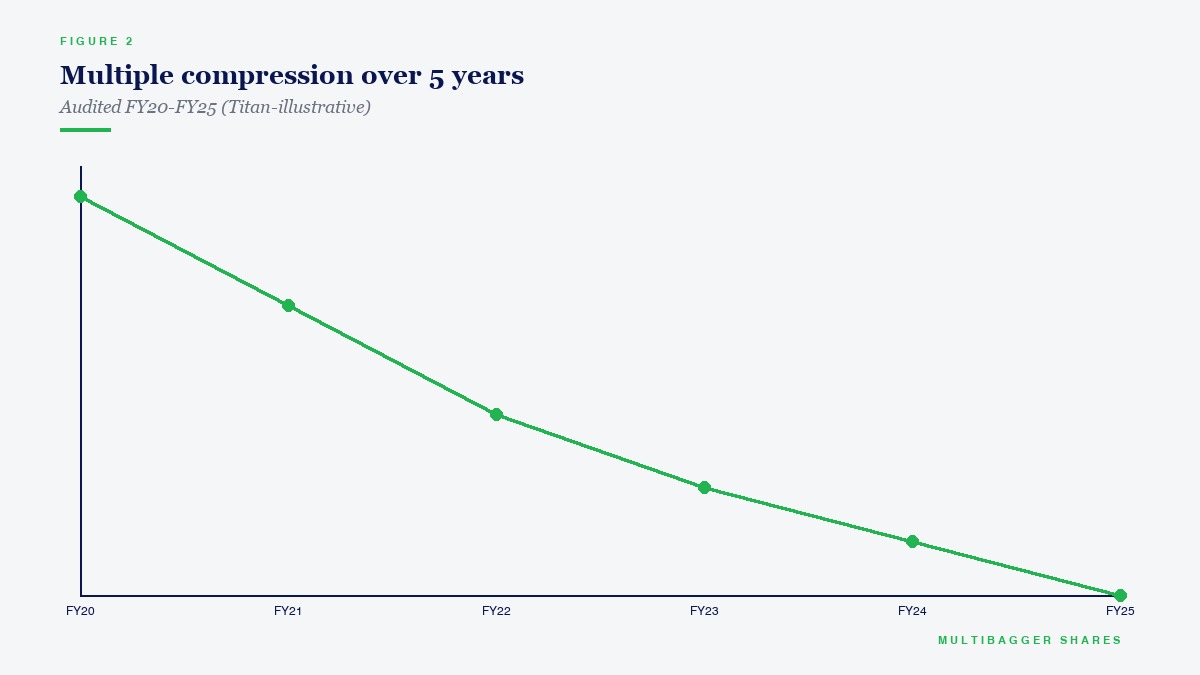
With a market cap of ₹1,694 Cr, stock price of ₹410, ROCE of 16.9%, promoter holding of 55.78%, debt-to-equity of just 0.02x, and a profit CAGR of 26% over 5 years, Titan Biotech demonstrates that superior diversification is not just a risk management strategy — it is a competitive moat that deserves a quality premium.
A Five-Point Framework for Every Stock You Evaluate
Point 1 — The 10% Rule: Does any single customer contribute more than 10% of revenue? If yes, flag it. If yes and the company has not disclosed it clearly, that is a governance red flag.
Point 2 — Trend Direction: Is concentration increasing or decreasing over the last 3 years? Increasing concentration in a growing business still creates future vulnerability.
Point 3 — Switching Cost Analysis: How easy is it for that large customer to switch to a competitor? If the product is commoditised and switching cost is zero, the concentration risk is existential. If the company has proprietary technology or regulatory approvals embedded in the relationship, the risk is lower.
Point 4 — Customer Financial Health: Is the large customer itself financially healthy? A concentrated revenue source that is also financially leveraged or in a declining industry doubles the risk exponentially.
Point 5 — Management’s Diversification Plan: Is the management actively investing in new geographies, new product lines, or new channels to reduce concentration? Management candour on this topic is itself a quality signal.
Build Long-Term Wealth, Not Short-Term Thrills
Understanding customer concentration risk is exactly the kind of deep fundamental research that separates long-term wealth creators from short-term speculators. This is not information you will find on a trading screen. It requires reading annual reports, asking the right questions, and thinking like a business owner.
SEBI data reveals that 9 out of 10 individual traders in the Futures & Options segment incur net losses. F&O trading is essentially gambling dressed up in financial language. The quality investors who build genuine wealth — studying customer concentration, geographic diversification, management integrity, and financial resilience — consistently outperform because they are buying businesses, not betting on price movements.
For our complete value investing education series, watch our YouTube playlist: Value Investing Course by Manish Goel
Key Takeaways
Customer concentration risk is one of the most underappreciated threats in Indian small-cap investing. A company with excellent financials but high revenue concentration is structurally fragile. Read the annual report, find the customer disclosures, assess the trend, and avoid businesses where a single relationship holds the company hostage. Titan Biotech’s 100+ country export footprint is a blueprint for what low-concentration, high-quality businesses look like. Build a portfolio of such businesses, hold them patiently, and let compounding create generational wealth.
SEBI Disclaimer: 9 out of 10 individual traders in the equity Futures & Options segment incurred net losses according to a SEBI study. F&O trading is essentially gambling. Focus on quality stock picking and long-term value investing instead.
Disclaimer: The author (Manish Goel) is a SEBI Registered Research Analyst (Registration No. INH100004775) and Manish Goel Portfolio Management Service (Manish Goel) is a SEBI Registered Research Analyst (Registration No. INH100004775). This post is for educational purposes only and should not be construed as a buy/sell recommendation. Please do your own research and consult a qualified financial advisor before making investment decisions. Stock market investments are subject to market risks. Past performance is not indicative of future results.
📱 Join Our Free Telegram Channel
Get daily value investing insights, market updates, and Titan Biotech analysis — completely free.
Join @longtermequityy on Telegram →