Value Investing Course

May 23, 2026
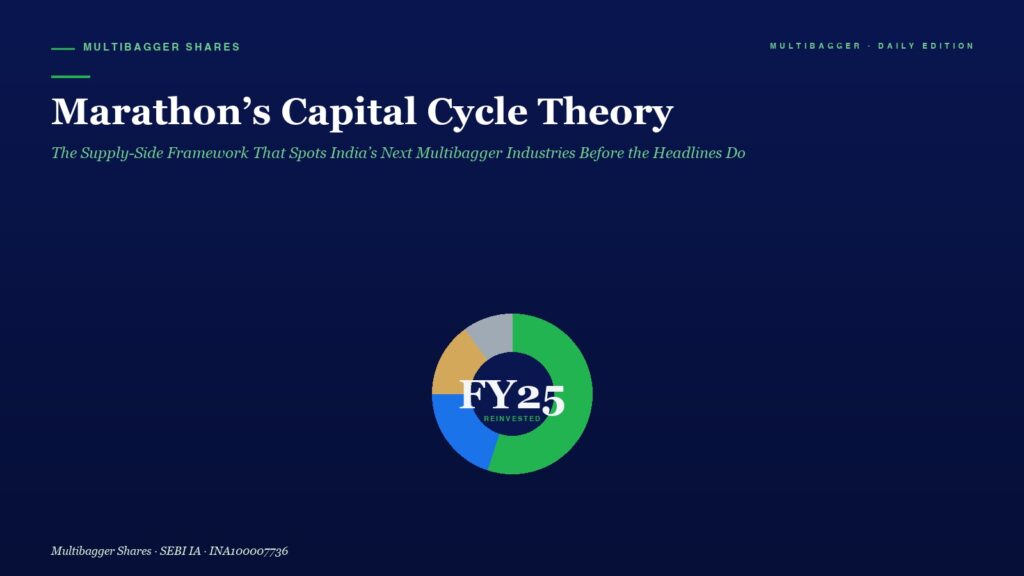
Headline: Marathon’s Capital Cycle Theory with a green accent bar and subtitle against a dark blue gradient background, centered donut chart labeled FY25 Reinvested at the bottom.

Marathon’s Capital Cycle Theory: The Supply-Side Framework That Spots India’s Next Multibagger Industries Before the Headlines Do

Marathon Asset Management's Capital Cycle Theory tells Indian value investors to count plants, not consumers — the supply-side framework that predicts industry returns better than any demand forecast.
April 22, 2026
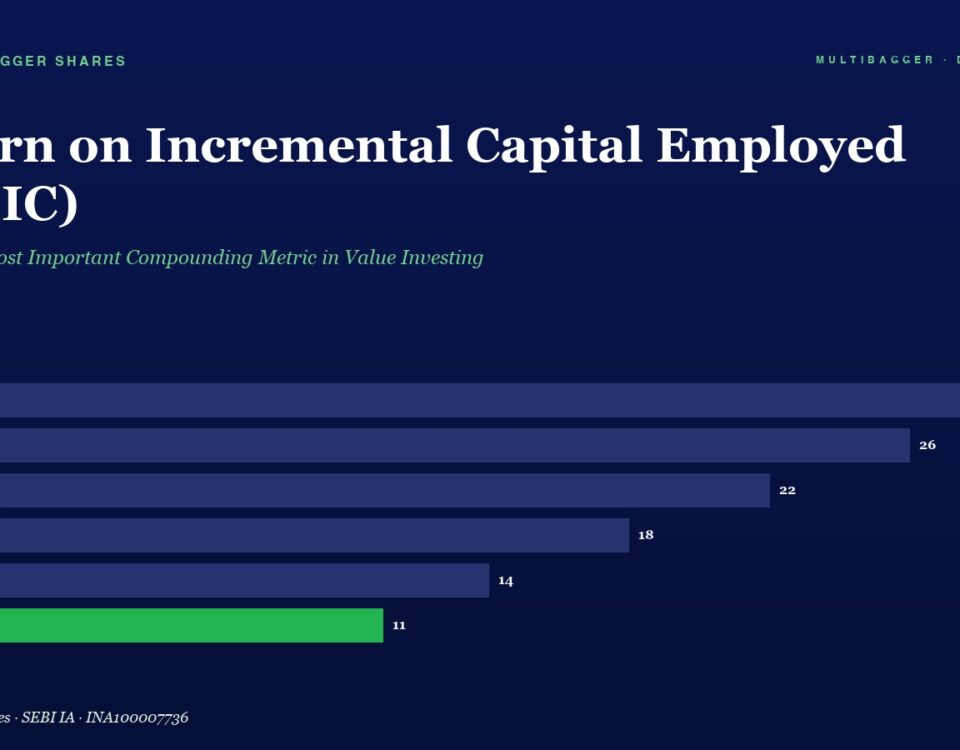
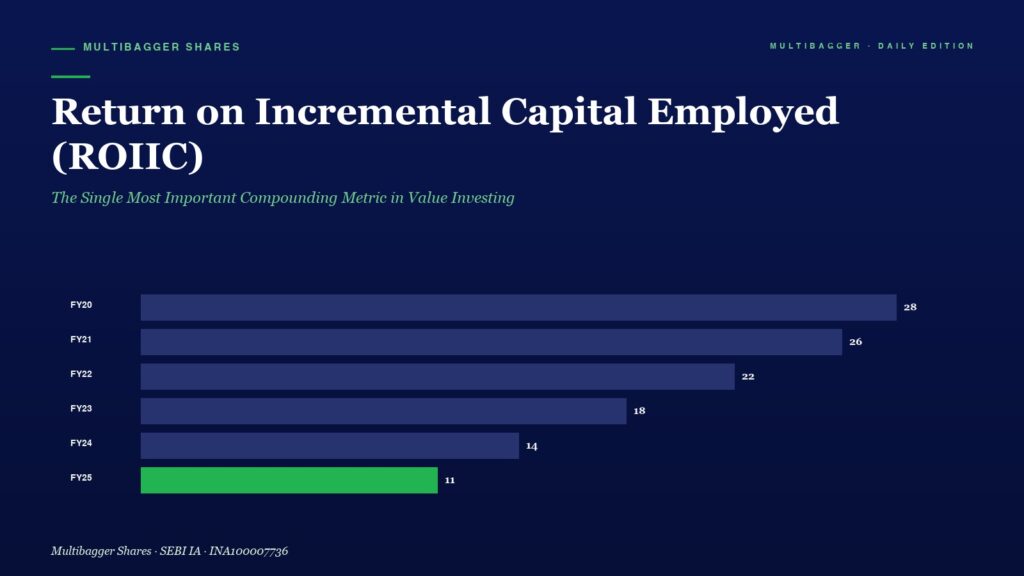
Infographic showing ROIC by year with horizontal bars: FY20 28, FY21 26, FY22 22, FY23 18, FY24 14, FY25 11; FY25 bar in green highlighting final value.

Return on Incremental Capital Employed (ROIIC): The Single Most Important Compounding Metric in Value Investing

ROIIC — not ROCE — is the metric Buffett, Munger, Fisher, Klarman, and Mauboussin converge on as the true long-term compounding signal. Here's how to calculate it on any Indian listed company, common mistakes to avoid, and a positive Titan Biotech FY25 case study with 9 audited disclosures.
April 15, 2026
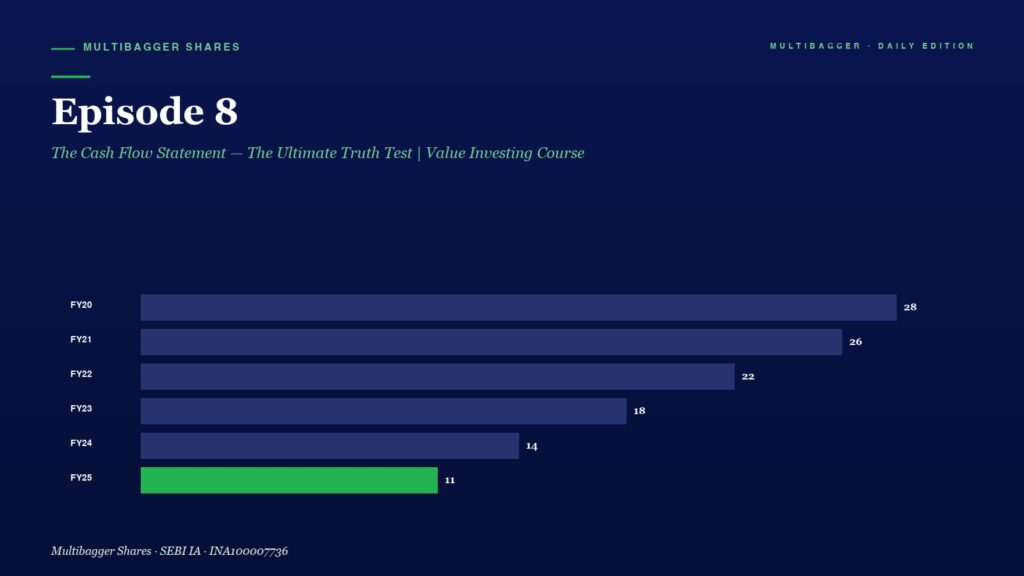
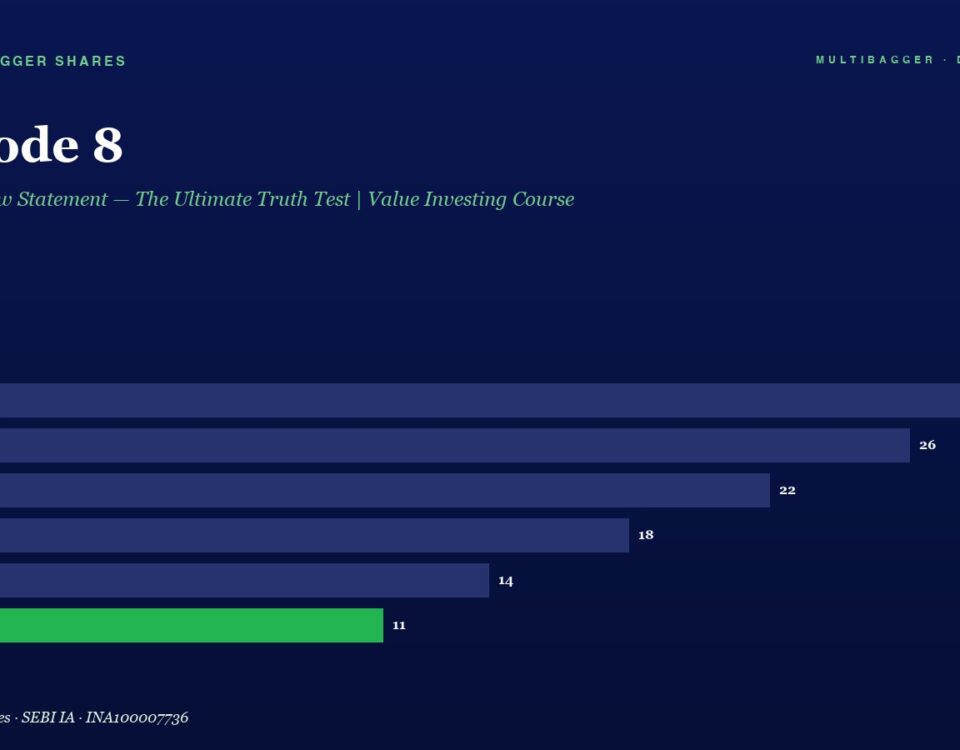
Episode 8 banner with a horizontal bar chart of yearly values: FY20 28, FY21 26, FY22 22, FY23 18, FY24 14, FY25 11; FY25 bar shown in green.

Episode 8: The Cash Flow Statement — The Ultimate Truth Test | Value Investing Course

April 15, 2026
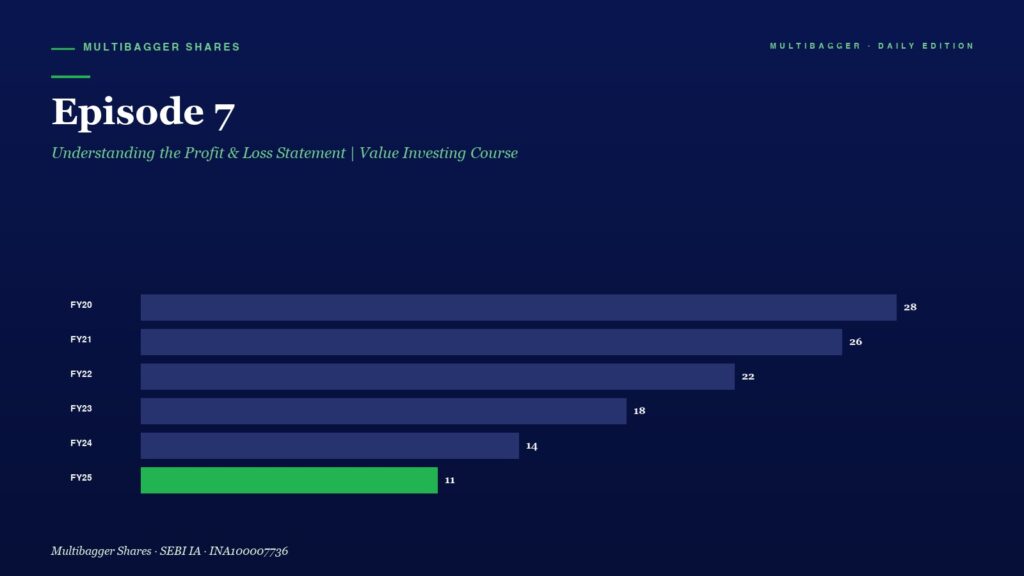
Episode 7 title with subtitle and a horizontal bar chart showing yearly values FY20–FY25; the FY25 bar is green and labeled 11.

Episode 7: Understanding the Profit & Loss Statement | Value Investing Course

+91-7380122211