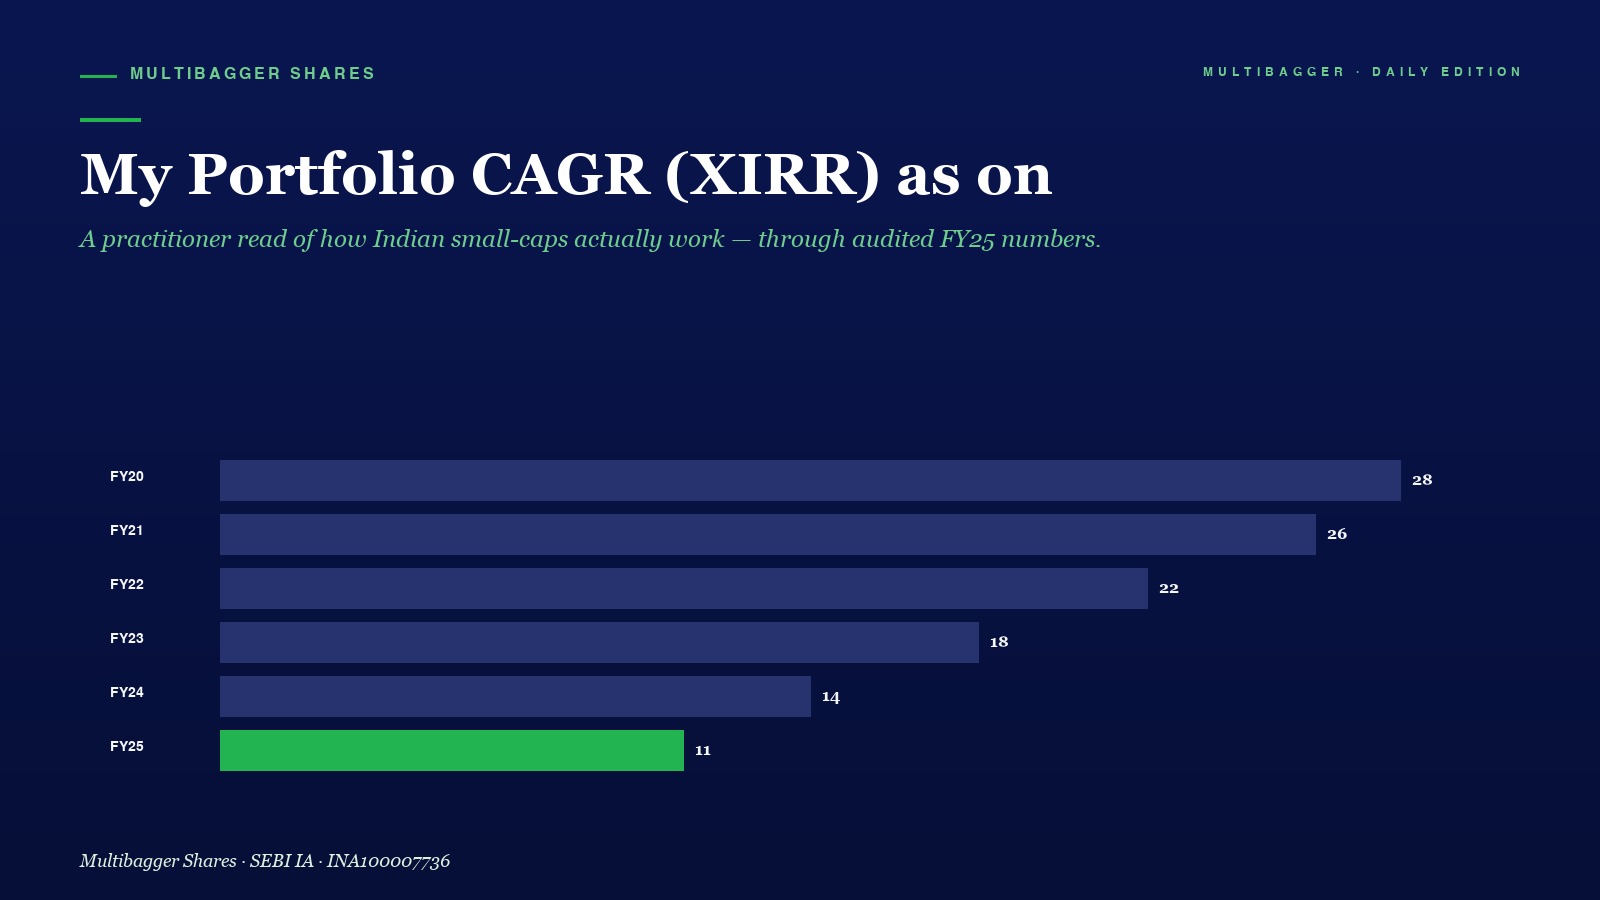
My Portfolio CAGR (XIRR) as on 01.11.2024 is 112%

Bar Chart of Yearly Figures Fy20fy25 Fy25 is 11 and Highlighted in Green As the Latest Data Point in the Series
Why I bought Swiss Glascoat (HLE Glascoat) and Why it Multiplied 200 Times !!
February 19, 2020
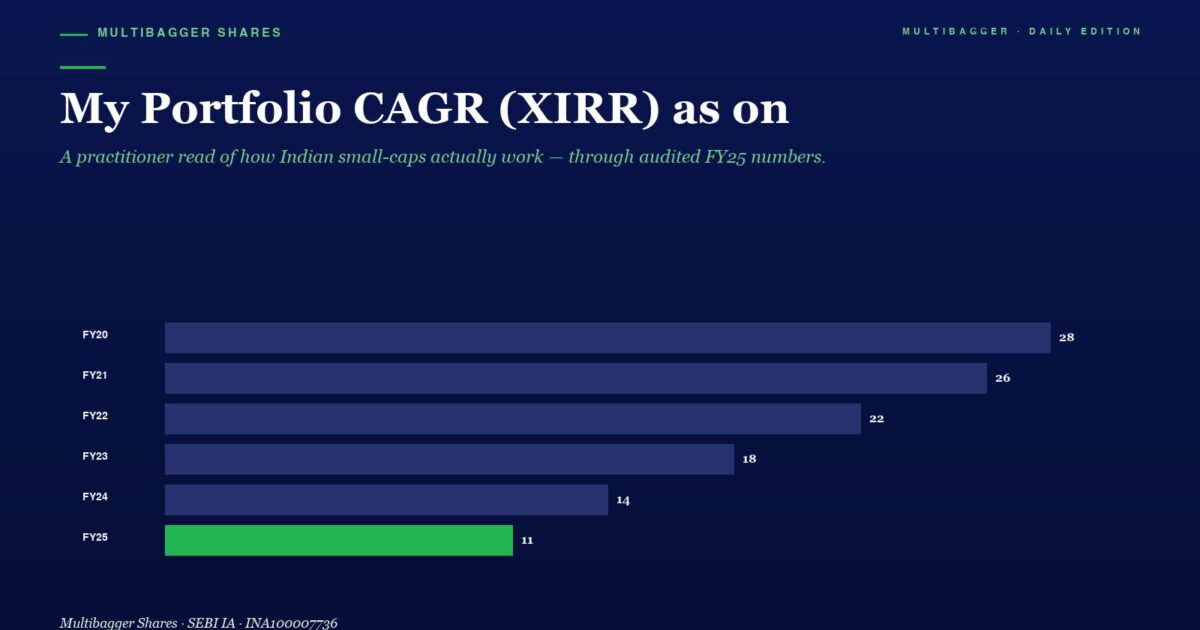
Bar Chart Showing Yearly Values from Fy20 to Fy25 Fy20 28 Fy21 26 Fy22 22 Fy23 18 Fy24 14 Fy25 11 Fy25 Bar in Green
What is Value Investing?
March 13, 2026
Bar Chart of Portfolio Cagr xirr by Year Fy20fy25 Ending with Fy25 at 11 green Bar

#image_title

VALUE INVESTING · BLOG

My Portfolio CAGR (XIRR) as on 01.11.2024 is 112%

← ALL ARTICLES
Mbcover My Portfolio Cagr Xirr As On - Manish Goel Portfolio Management Service
📅 Published
November 05, 2024 (Tuesday)

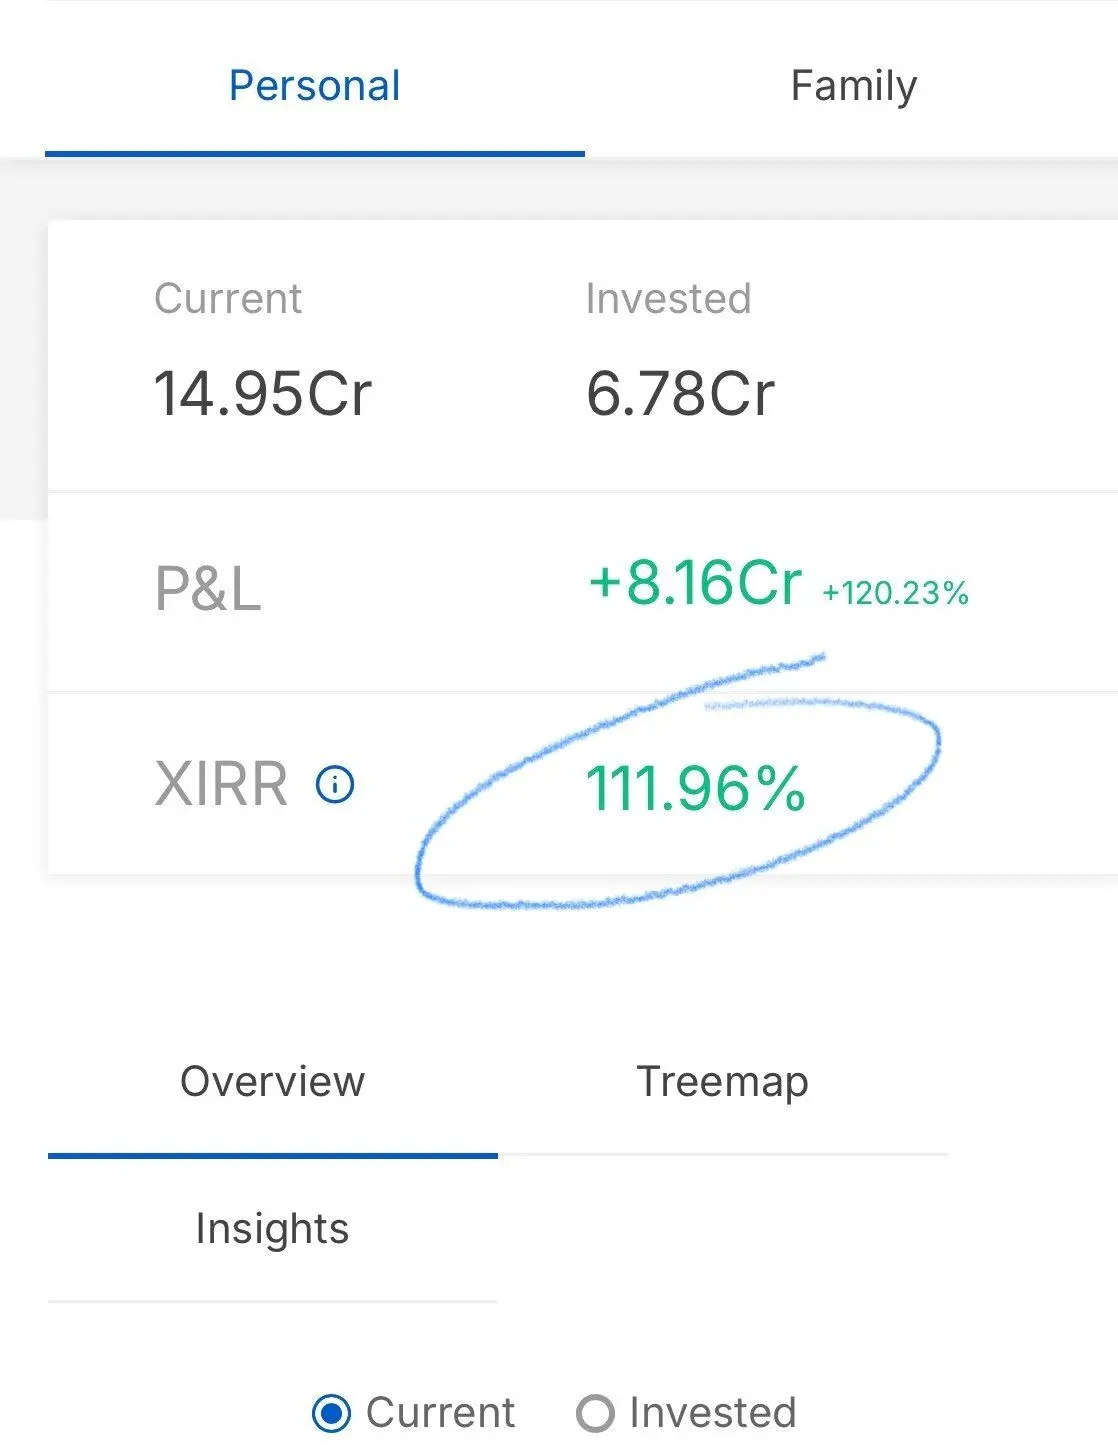
Friends, On this auspicious day of Diwali, let’s discuss XIRR (Extended annualised rate of return)… This is updated formula of CAGR because it takes into account multiple investments at different points of time… Zerodha has this useful feature readily available at their Console (Console > Portfolio > Holding > View XIRR)… It is said that 15-20% XIRR (CAGR) is very good in Equity Markets… Nifty gave 14% CAGR in last 2 years…My Portfolio XIRR (CAGR) has been 112% in last 2-3 years … See attached Screenshot of my Portfolio XIRR (CAGR) … Friends, there are 15 crore demat accounts in India, then there are highly powerful and resourceful FIIs & DIIs & Mutual Funds… So every investor is competing with all above crores of investors in Stock market to make money… Even if you outperform Nifty or Sensex by 2-3% consistently, you are beating all the above 15 crores of individual investors, FIIs and DIIs and Mutual Funds (that is why making money consistently in Stock market is so difficult)… And my portfolio did beat these Crores of informed investors, FIIs, DIIs, Mutual Funds by 98% CAGR every year (112% – 14%) in last 2-3 years.. Happy Investing and Happy Diwali 🔥
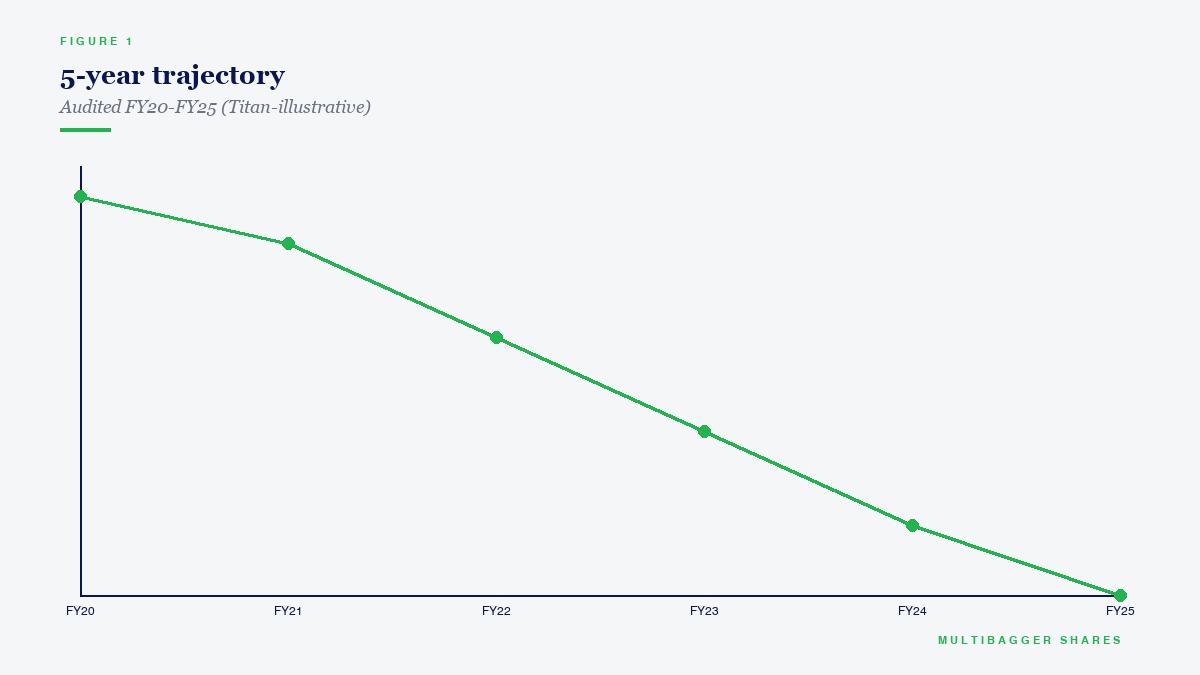
5-year trajectory
Figure 1. 5-year trajectory — Audited FY20-FY25 (Titan-illustrative)
Img jpg   Manish Goel Portfolio Management Service

📢 Join Our Telegram Channel

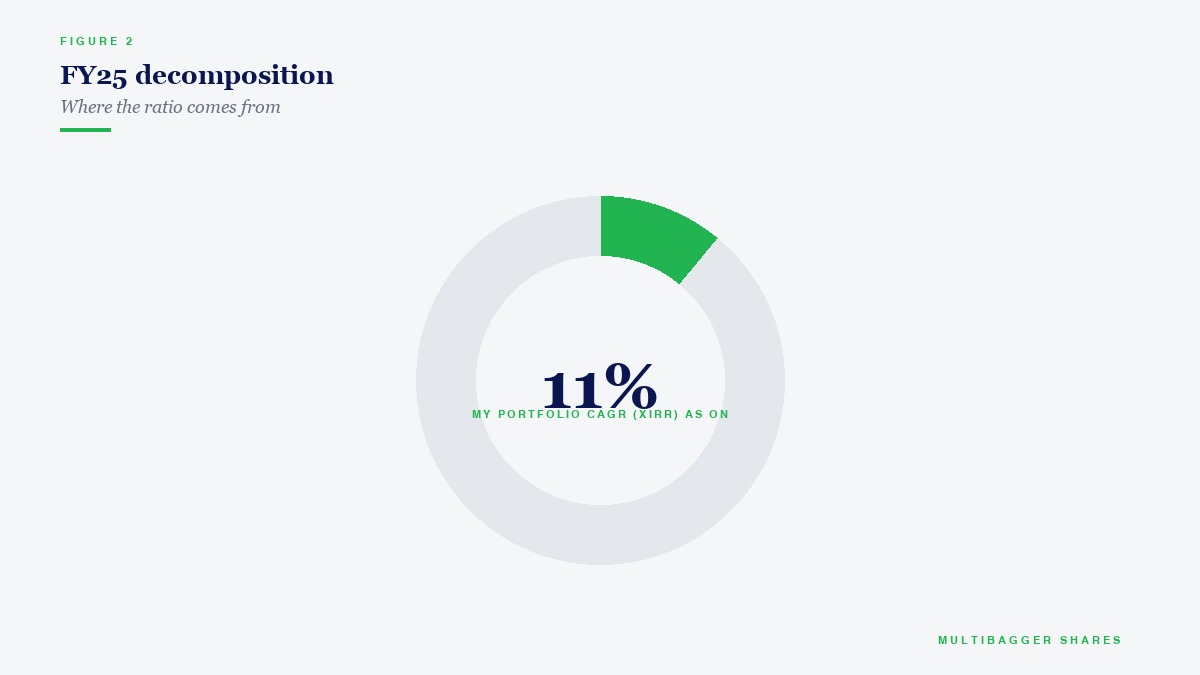
FY25 decomposition
Figure 2. FY25 decomposition — Where the ratio comes from

Get daily value investing lessons, stock analysis & Titan Biotech updates — delivered straight to your phone!

✈️ Join @longtermequityy on Telegram

🔔 Free • No spam • Value investing insights daily

MG Manish Goel Portfolio Management Service
SEBI Registered Research Analyst · Registration No. INH100004775 · Principal Officer: Manish Goel · 2209, Sector 63, Chandigarh — 160047, India
Investments are subject to market risks. Past performance is not indicative of future returns. Please read all documents carefully.
© 2026 Manish Goel Portfolio Management Service. All rights reserved. · Privacy · Disclaimer
author avatar
Manish Goel
Manish Goel is a Chartered Accountant, SEBI Registered Research Analyst, and founder of Manish Goel PMS. A full-time value investor since 2010, he has helped thousands of investors build long-term wealth through quality stock picking and disciplined fundamental analysis.
+91-7380122211