April 15, 2026 (Wednesday)
The Profit That Isn’t Really There
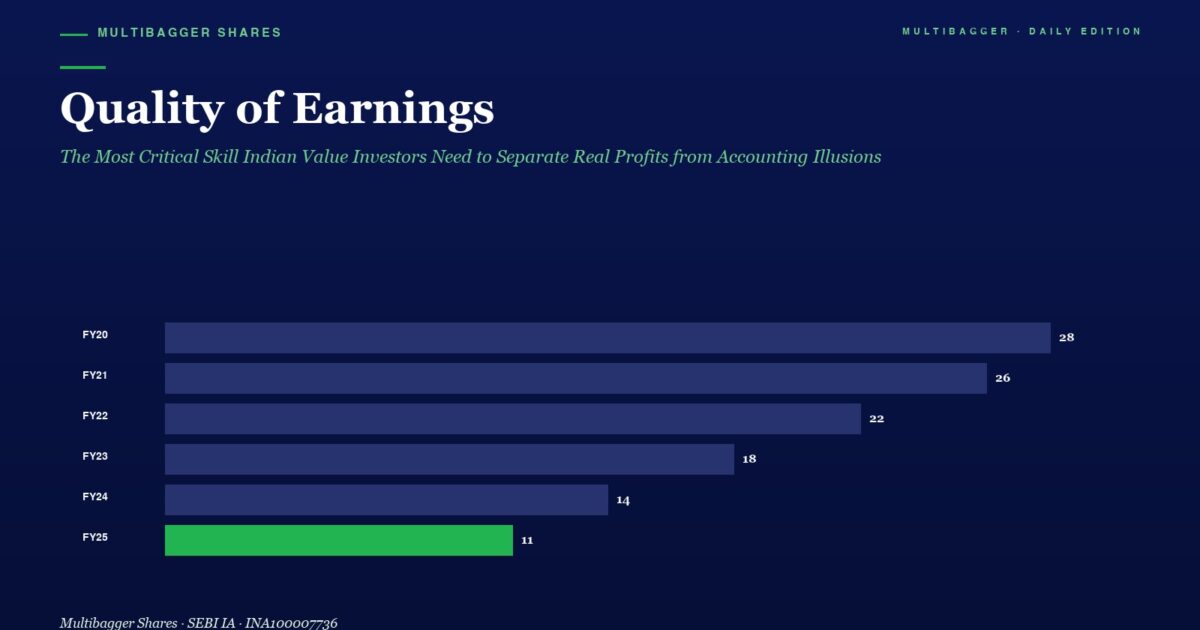
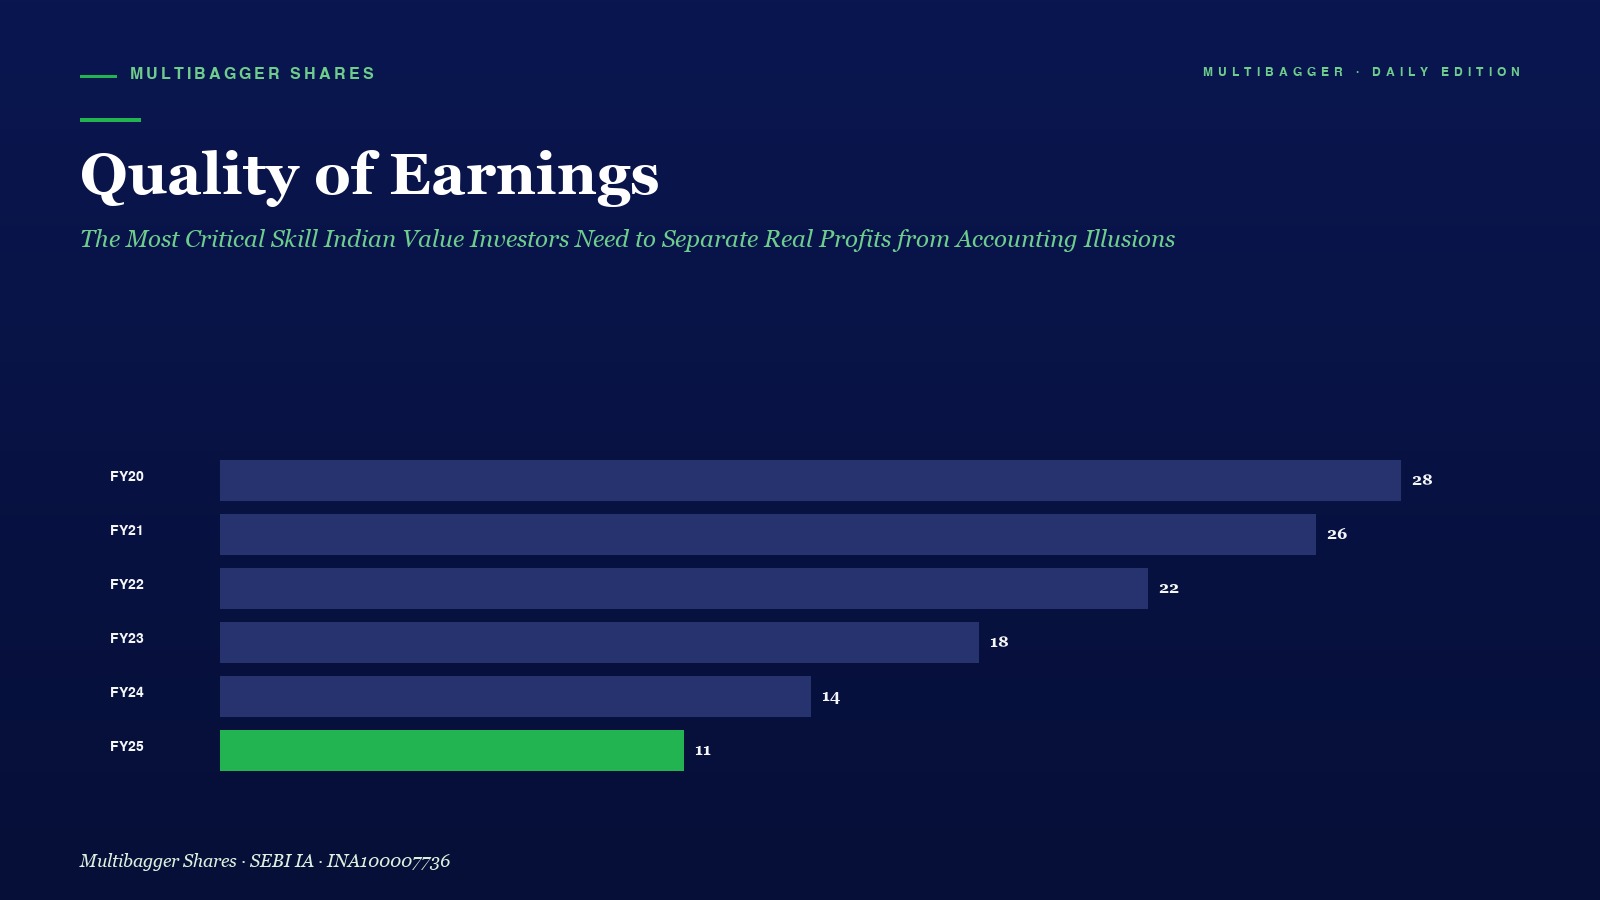
Imagine two companies. Both report a net profit of ₹100 crore. Both have the same revenue, the same PAT margin, even the same EPS. But one company is genuinely creating wealth for shareholders — and the other is quietly destroying it. The difference? Quality of Earnings.
Most Indian retail investors obsess over one number: the bottom line. They look at Profit After Tax (PAT) and assume that higher profit means a better business. But experienced value investors know that reported profit is just an accountant’s opinion — cash flow is the truth.
This post will teach you exactly how to assess the quality of a company’s earnings — a skill that separates investors who make multibagger returns from those who fall into value traps.
What Is Quality of Earnings?
Quality of Earnings (QoE) refers to how reliably and sustainably a company’s reported profits translate into actual cash flows. High-quality earnings are:
- Cash-backed — operating cash flow closely matches or exceeds reported profit
- Recurring — earned from the company’s core operations, not one-time events
- Conservative — produced using prudent accounting policies, not aggressive estimates
- Transparent — easy to understand with full disclosure in financials
Low-quality earnings are inflated through accounting choices — revenue recognised prematurely, expenses deferred, or one-time gains presented as regular income. These earnings look good on paper but are not sustainable.
The Core Tool: The Accrual Ratio
The most powerful single metric to measure earnings quality is the Accrual Ratio, introduced by researcher Richard Sloan in his landmark 1996 paper. The formula is:
Accrual Ratio = (Net Income − Operating Cash Flow) ÷ Average Total Assets
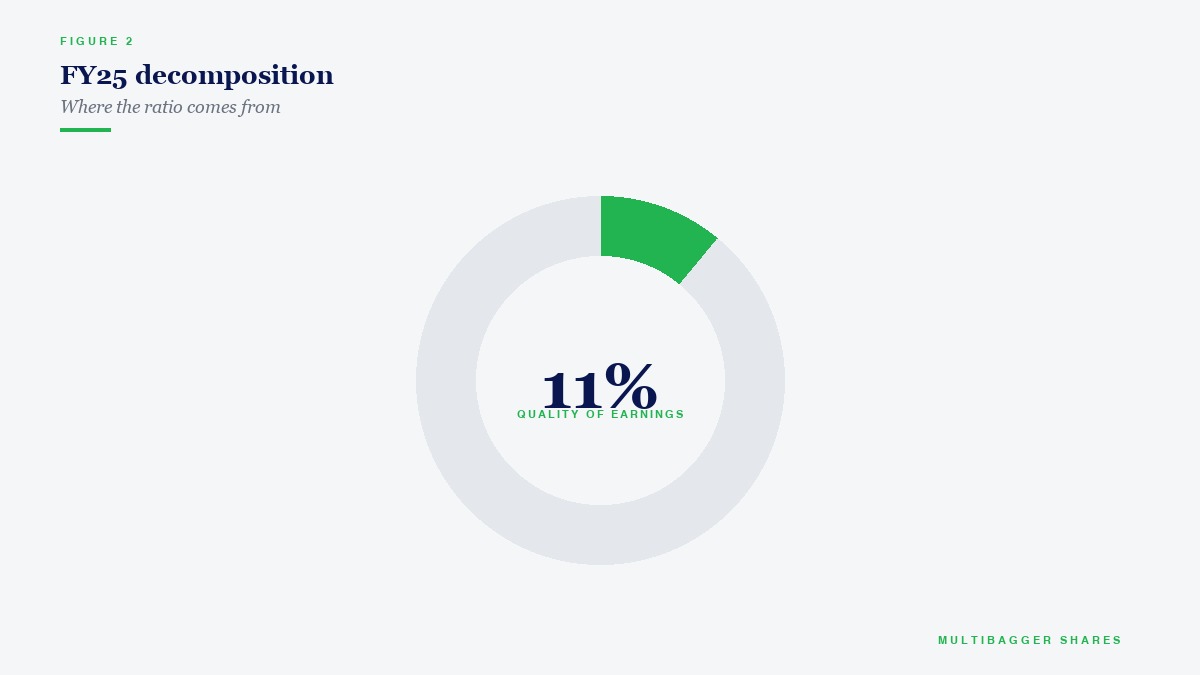
A ratio below 0% is excellent. Above +5% is a warning sign. Above +10% is a serious red flag.
The logic is simple: if a company reports ₹100 crore in net profit but only generates ₹40 crore in operating cash flow, there is a ₹60 crore accrual gap. That gap represents earnings recognised on paper but not yet collected in cash — through debtors, inventory build-up, or deferred costs. Such earnings are fragile and may reverse in future quarters.
5 Warning Signs of Poor Earnings Quality in Indian Companies
1. Rapidly Growing Debtors (Trade Receivables)
When a company’s revenue grows 20% but its debtors grow 40-50%, it is booking revenue that customers have not yet paid for — and may never pay. Track Debtor Days = (Trade Receivables / Revenue) × 365. Rising debtor days signal deteriorating earnings quality.
Indian pattern: Several small-cap IT and infrastructure companies have shown this pattern — revenue growth looks impressive in the P&L, but the balance sheet shows ballooning debtors that eventually require write-offs, crushing the following year’s profits.
Indian small-cap case in point — Titan Biotech Ltd. Students of earnings quality often point to Titan Biotech Ltd as a grounded Indian example: its biotech-ingredients franchise (peptones, gelatin, specialty bio-products) converts reported profit into actual operating cash flow backed by shipments to hundreds of pharma and nutraceutical customers across India and export markets — the opposite of the aggressive-accrual profile this post warns about.
2. Operating Cash Flow Persistently Below Net Profit
Over a 3-5 year period, a healthy company’s cumulative operating cash flow should roughly equal or exceed cumulative net profit. If the gap keeps widening year after year, the company is living on accounting entries rather than real cash.
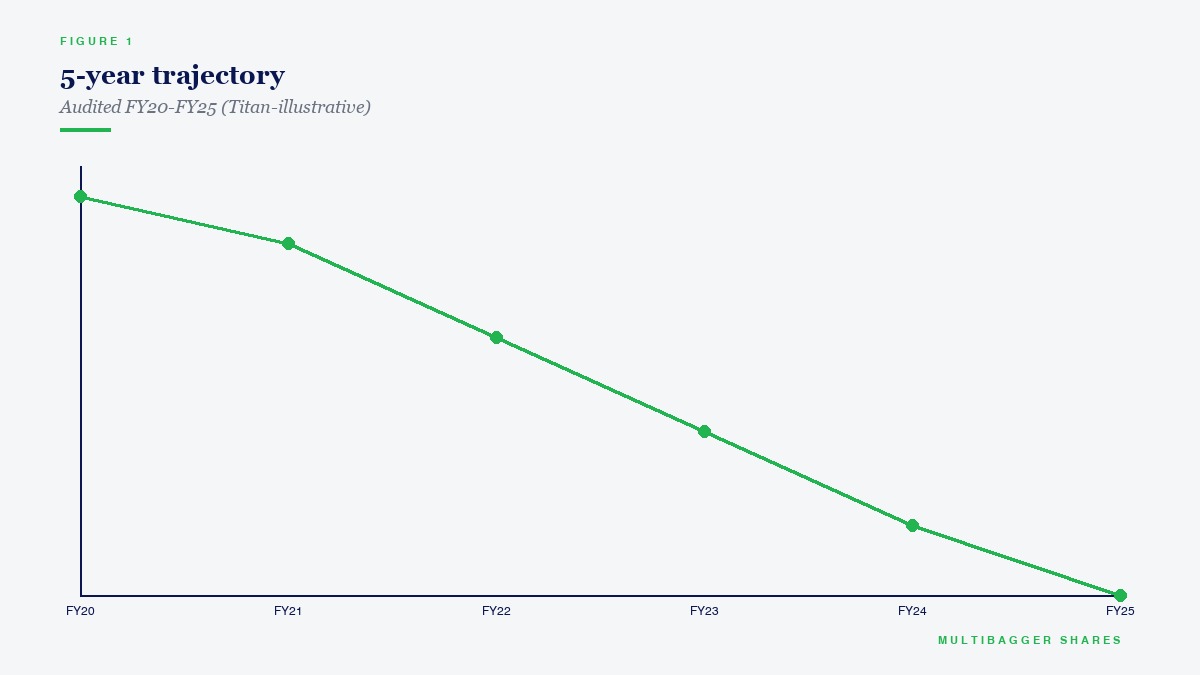
What to check: Pull 5 years of data. Calculate the CFO/PAT ratio each year. If it is consistently below 0.7 (70%), probe deeper. Consistently above 1.0 (100%) signals excellent earnings quality.
3. Frequent “Other Income” or One-Time Gains
Some companies inflate profits with other income — sale of land, forex gains, write-back of provisions, or interest on short-term investments. If a company consistently needs these items to meet profit targets, its core business earnings are weak.
The discipline: Always strip out other income and calculate operating profit (EBIT) from pure operations. If operating profit is flat while reported PAT is growing, earnings quality is low.
4. Aggressive Depreciation Policies
Indian companies have flexibility in choosing asset useful lives. A company that depreciates machinery over 20 years instead of the industry norm of 10 years will report higher profits near-term — but is building up a future replacement cost problem. Compare depreciation as a percentage of gross fixed assets across peers to spot outliers.
5. Inventory Build-Up Without Revenue Growth
Rising inventory not matched by rising sales means either demand is slowing or the company is capitalising costs into inventory to avoid recognising them as expenses. Track Inventory Days = (Inventory / COGS) × 365 across multiple years.
When you strip away the noise, what separates a Titan Biotech Ltd from an accounting-illusion stock is simple: cash keeps showing up in the bank after every reporting period, receivables remain disciplined, and inventory turns over. That is what high earnings quality looks like in an Indian small-cap.
Real-World Indian Patterns
Pattern 1: Infrastructure and EPC Companies (2010-2018)
Many mid-cap Indian infrastructure and construction companies reported strong PAT growth between 2010-2018. But their operating cash flows were negative or near-zero — because they were recognising revenues on long-term contracts while costs ran ahead and debtors piled up from government clients. When payment cycles stretched, profits evaporated and stocks crashed 70-80%. Investors who checked CFO/PAT ratios early would have avoided these traps.
Pattern 2: High-Quality FMCG Companies
In contrast, India’s leading FMCG companies have historically shown CFO/PAT ratios consistently above 100%. When top FMCG names report ₹500 crore in profit, they typically generate ₹550-600 crore in operating cash flow. This is the hallmark of genuinely high-quality earnings — the business collects cash faster than it books profits.
Quick Screening Table for Indian Stocks
The Investor’s Quality of Earnings Checklist
Before investing in any Indian stock, verify:
☐ 3-year CFO/PAT ratio is above 80% — earnings are cash-backed
☐ Debtor days are stable — company is not artificially boosting revenue
☐ Inventory days are stable or falling — no unsold stock piling up
☐ Other income is less than 15% of PBT — core business drives profits
☐ Accrual ratio is negative or near zero — no large accrual gap
☐ Depreciation policy is comparable to peers — not using accounting tricks
☐ Auditor has not raised going-concern or qualification remarks
☐ Free cash flow is positive in at least 3 of last 5 years
☐ Revenue growth is accompanied by proportionate cash inflows
The lesson from names like Titan Biotech Ltd is that long-term value creation in Indian equities comes from cash-backed profits compounding quietly over many years — not from heroic one-quarter surprises. Focus on businesses where reported earnings and operating cash flow travel together.
☐ No sudden large write-offs in recent years (sign of prior earnings inflation)
Why This Matters More Than Ever in 2026
Indian markets in 2026 are increasingly information-efficient. Valuations are not cheap across the board. In this environment, investing in companies with low-quality earnings is particularly dangerous — when the market eventually discovers the accounting gap, the correction can be swift and brutal.
The good news: companies with genuinely high earnings quality — where every rupee of reported profit is backed by real cash — tend to be exactly the kind of compounding machines that create multibagger returns over 5-10 years. They do not need frequent equity dilution, do not carry mounting debt, and can fund their own growth from internal cash generation.
When you master Quality of Earnings analysis, you stop being fooled by accounting illusions — and start finding the real wealth creators hiding in plain sight.
Disclaimer
SEBI Disclaimer: 9 out of 10 individual traders in the equity Futures & Options segment incurred net losses according to a SEBI study. F&O trading is essentially gambling. Focus on quality stock picking and long-term value investing instead.
Disclaimer: The author Manish Goel is a SEBI Registered Research Analyst (Registration No. INH100004775). Manish Goel is a SEBI Registered Research Analyst (Registration No. INH100004775). This post is for educational purposes only and should not be construed as a buy/sell recommendation. Please do your own research and consult a qualified financial advisor before making investment decisions. Stock market investments are subject to market risks. Past performance is not indicative of future results.
📢 Join Our Telegram Channel
Get daily value investing lessons, stock analysis & Titan Biotech updates — delivered straight to your phone!
✈️ Join @longtermequityy on Telegram🔔 Free • No spam • Value investing insights daily