April 07, 2026 (Tuesday)
Why Most Indian Investors Get Valuation Completely Wrong
Here is a question that separates serious investors from speculators: if a stock pays you ₹10 in dividends this year, and that dividend grows at 15% every year, while your required return is 18% — what is that stock actually worth?
Most retail investors in India have no idea how to answer this question. They rely on tips from WhatsApp groups, chase momentum, or gamble in Futures & Options. But the greatest investors in history — from Myron Gordon to Warren Buffett — have always understood that the intrinsic value of any asset is the present value of all future cash flows it will generate for you.
Today, with the NIFTY 50 at 23,123.65 and the SENSEX at approximately 74,107 (as of April 7, 2026), markets have rallied for four consecutive sessions. In times like these, it becomes even more critical to have a rigorous valuation framework. You need a method that tells you whether a stock is truly cheap or whether the market has already priced in all the growth. That method is the Gordon Growth Model (GGM).
What Is the Gordon Growth Model?
The Gordon Growth Model — also called the Gordon Dividend Discount Model — was developed by economist Myron J. Gordon in 1956 at MIT. It is one of the most elegant formulas in all of finance, and it answers one fundamental question: What is a stock worth if its dividends grow at a constant rate forever?
The formula is beautifully simple:
V₀ = D₁ / (r − g)
Where:
- V₀ = Intrinsic value of the stock today
- D₁ = Expected dividend per share next year (i.e., D₀ × (1 + g))
- r = Required rate of return (your expected return as an investor)
- g = Constant growth rate of dividends (must be less than r)
That is it. Three inputs, one formula, and you get an estimate of what any dividend-paying stock is truly worth. The genius of the Gordon Growth Model lies in its simplicity — it distills the infinite stream of future dividends into a single present value.
The Logic Behind the Formula — Why It Works
Think about it this way: when you buy a stock, you are buying a stream of future cash flows. For a dividend-paying company, those cash flows come in the form of dividends. If a company pays ₹10 in dividends today, and that dividend grows at 12% per year, then next year you get ₹11.20, the year after ₹12.54, then ₹14.05, and so on. Each of those future dividends is worth less today because of the time value of money — a rupee today is worth more than a rupee tomorrow.
The Gordon Growth Model takes this infinite series of growing dividends, discounts each one back to the present, and adds them all up. The mathematical magic is that this infinite sum converges to a finite number — D₁ / (r − g) — as long as the growth rate (g) is less than the discount rate (r). This is not just theory. It is the foundation upon which the world’s greatest investors value businesses.
A Step-by-Step Example with an Indian Stock
Let us walk through a practical example. Imagine a well-established Indian company — let us call it “Quality Pharma Ltd” — with the following characteristics:
- Current dividend per share (D₀): ₹8
- Expected dividend growth rate (g): 14% per year
- Your required rate of return (r): 18% per year
Step 1: Calculate D₁ (next year’s expected dividend)
D₁ = D₀ × (1 + g) = ₹8 × 1.14 = ₹9.12
Step 2: Apply the Gordon Growth Model formula
V₀ = D₁ / (r − g) = ₹9.12 / (0.18 − 0.14) = ₹9.12 / 0.04 = ₹228
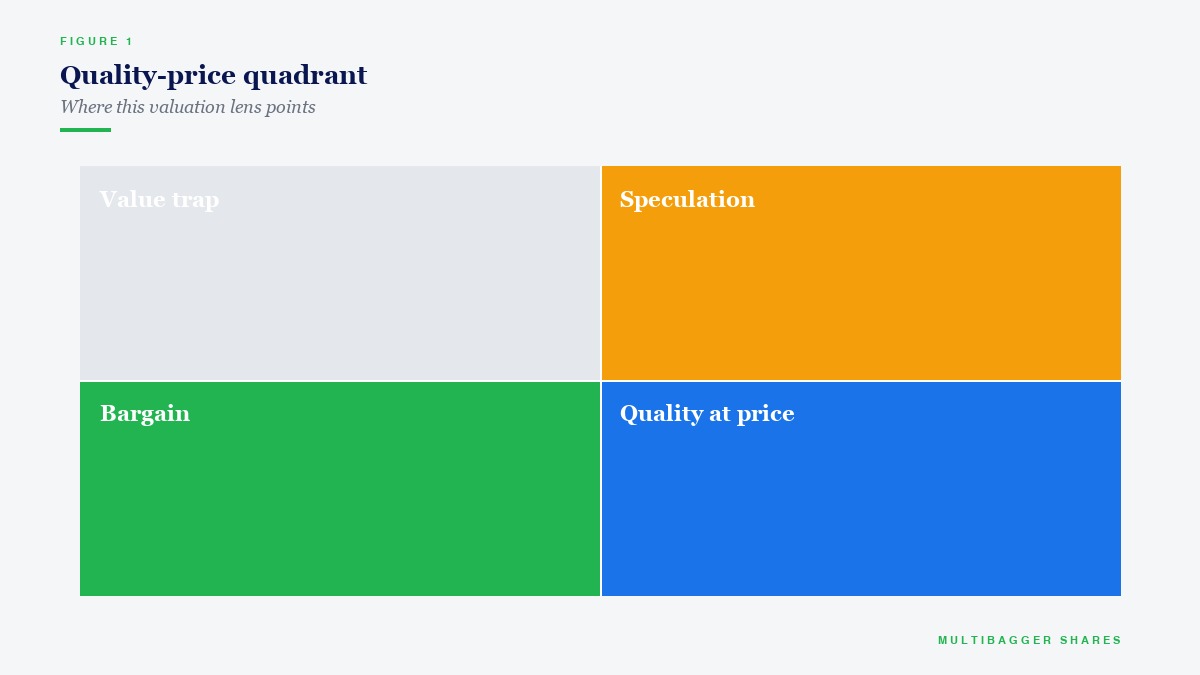
This means the intrinsic value of Quality Pharma is ₹228 per share. If the stock is trading at ₹180, it is undervalued — you are getting a bargain. If it is trading at ₹350, it is overvalued — the market has priced in more optimism than the fundamentals warrant.
This is the power of the Gordon Growth Model — it gives you a concrete number to anchor your investment decisions, instead of relying on guesswork or market noise.
The Three Critical Inputs — Getting Them Right
1. Estimating the Dividend Growth Rate (g)
This is the most important and most difficult input. You cannot simply look at one year of dividend growth. You need to analyze at least 7-10 years of dividend history. Look at the compounded annual growth rate (CAGR) of dividends over the past decade. Cross-check this with the company’s earnings growth, because dividends cannot grow faster than earnings indefinitely.
For quality compounders like Titan Biotech (BSE: 524717), currently trading at approximately ₹529 with a market cap of around ₹700+ Cr, the company has maintained an unbroken dividend track record for over 14 years. This kind of consistency is exactly what you look for when applying the Gordon Growth Model — a company with a predictable, sustainable dividend growth trajectory backed by genuine earnings power.
2. Determining Your Required Rate of Return (r)
Your required rate of return should reflect the risk of the investment. For Indian equities, a reasonable range is 14-20%. You can calculate this using the Capital Asset Pricing Model (CAPM): r = Risk-Free Rate + Beta × Equity Risk Premium. For most Indian small-cap and mid-cap stocks, a required return of 16-20% is reasonable. For large-cap blue chips, 12-15% may be appropriate.
3. The Crucial Constraint: g Must Be Less Than r
The model only works when the growth rate is less than the required return. If g ≥ r, the formula gives you a negative or infinite value, which is meaningless. This is actually a feature, not a bug — it is the model’s way of telling you that a stock growing faster than your required return cannot be valued using a single-stage model. You would need a two-stage or three-stage model for high-growth companies.
When the Gordon Growth Model Works Best — And When It Does Not
The GGM is most powerful for valuing mature, stable dividend-paying companies — the kind that form the backbone of a concentrated, high-conviction portfolio. Think of companies with consistent earnings, predictable cash flows, and a long history of paying and growing dividends.
Ideal candidates in the Indian market: Established FMCG companies, mature pharma players, well-run private banks with consistent dividend policies, and quality small-caps like Titan Biotech that have demonstrated decade-long dividend discipline.
Where the GGM struggles: High-growth companies that reinvest all earnings (zero dividends), cyclical businesses with volatile earnings, turnaround stories, and companies in their early growth phase. For these, you need different tools — DCF models, EV/EBITDA multiples, or reverse DCF analysis.
The Sensitivity Problem — Small Changes, Massive Impact
Here is something every Indian investor must understand about the Gordon Growth Model: it is extremely sensitive to small changes in inputs. Let me demonstrate:
Using our Quality Pharma example with D₁ = ₹9.12 and r = 18%:
- If g = 14%: V₀ = ₹9.12 / 0.04 = ₹228
- If g = 15%: V₀ = ₹9.12 / 0.03 = ₹304
- If g = 16%: V₀ = ₹9.12 / 0.02 = ₹456
- If g = 17%: V₀ = ₹9.12 / 0.01 = ₹912
See what happened? A change of just 1 percentage point in the growth rate assumption changes the valuation by 33-100%! This is why Warren Buffett says: “Wide diversification is only required when investors do not understand what they are doing.” When you truly understand a business — its growth rate, its competitive position, its management quality — you can make precise estimates. The Gordon Growth Model rewards depth of research, not breadth of holdings.
Advanced Applications for Indian Investors
Using GGM to Calculate the Implied Growth Rate
You can also reverse-engineer the model. If you know the current stock price, the dividend, and your required return, you can calculate what growth rate the market is implying:
g = r − (D₁ / P₀)
This is incredibly powerful. If the implied growth rate is unrealistically high (say, 25% forever), the stock is likely overvalued. If the implied growth rate is lower than the company’s actual historical growth, the stock may be a bargain.
Combining GGM with Other Valuation Tools
The smartest approach is to use the Gordon Growth Model alongside DCF analysis, Price-to-Book ratios, and EV/EBITDA multiples. When multiple methods point to the same conclusion — that a stock is undervalued — your conviction should be strongest. This is the approach we advocate at Manish Goel Portfolio Management Service: use every tool in your arsenal, but concentrate your capital in your 5-10 highest-conviction ideas.
The Anti-F&O Message — Why Valuation Beats Speculation
According to SEBI’s own study, 9 out of 10 individual traders in the equity Futures & Options segment incurred net losses. Think about that — 90% of F&O traders lose money. They are gambling on short-term price movements without any understanding of intrinsic value.
Meanwhile, investors who use tools like the Gordon Growth Model to estimate intrinsic value, who study a company’s dividend history, earnings growth, and competitive advantages — these investors build real wealth over decades. The choice is clear: you can either be a speculator who loses money 90% of the time, or a value investor who builds a concentrated portfolio of deeply researched compounders.
How to Learn More — Our Free Value Investing Course
If you want to master valuation techniques like the Gordon Growth Model, DCF analysis, and the 95-factor stock analysis framework that we use at Manish Goel Portfolio Management Service, check out our free value investing course on YouTube: Value Investing Course Playlist.
The course covers everything from understanding financial statements to advanced valuation methods — all explained with real Indian stock market examples.
Key Takeaways
1. The Gordon Growth Model (V₀ = D₁ / (r − g)) is one of the most powerful valuation tools ever created — simple yet profound.
2. It works best for mature, dividend-paying companies with predictable growth — exactly the kind of quality compounders that create long-term wealth.
3. The model is extremely sensitive to growth rate assumptions — which is why deep research into individual companies matters far more than diversifying across dozens of mediocre stocks.
4. You can reverse-engineer the model to find the market’s implied growth rate and identify mispriced stocks.
5. Always use GGM alongside other valuation methods for maximum conviction in your investment thesis.
SEBI Disclaimer: 9 out of 10 individual traders in the equity Futures & Options segment incurred net losses according to a SEBI study. F&O trading is essentially gambling. Focus on quality stock picking and long-term value investing instead.
Disclaimer: The author (Manish Goel) is a SEBI Registered Research Analyst (Registration No. INH100004775) and Manish Goel Portfolio Management Service (Manish Goel) is a SEBI Registered Research Analyst (Registration No. INH100004775). This post is for educational purposes only and should not be construed as a buy/sell recommendation. Please do your own research and consult a qualified financial advisor before making investment decisions. Stock market investments are subject to market risks. Past performance is not indicative of future results.
📢 Join Our Telegram Channel
Get daily value investing lessons, stock analysis & Titan Biotech updates — delivered straight to your phone!
✈️ Join @longtermequityy on Telegram🔔 Free • No spam • Value investing insights daily