Table of Contents
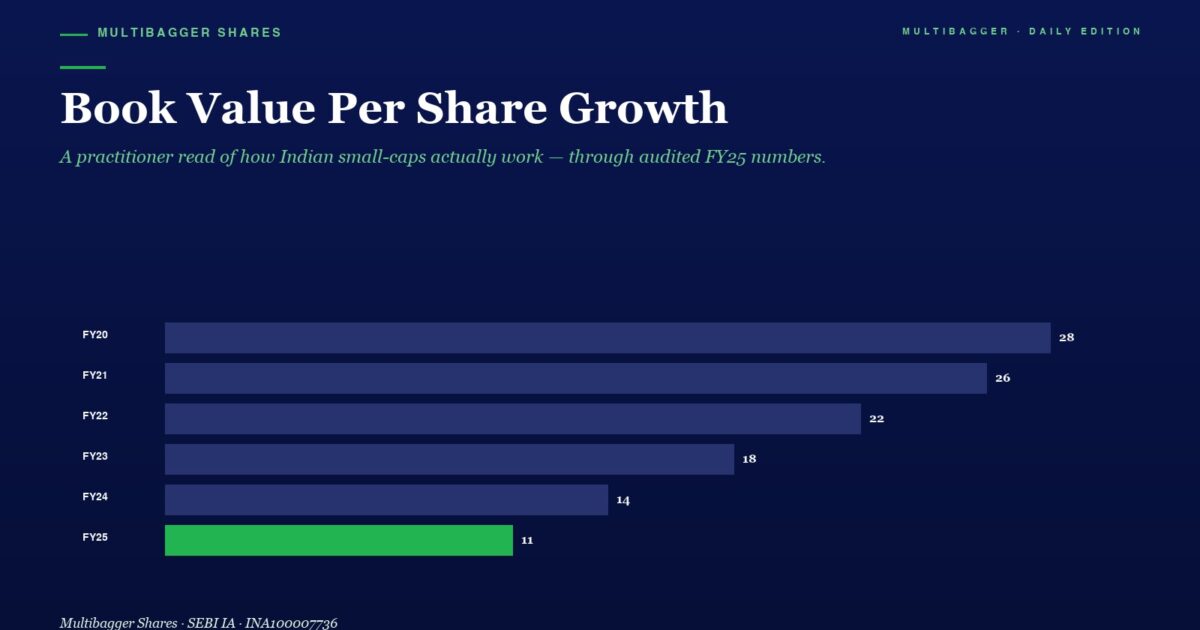
How does Titan Biotech’s book value growth compare to peers in the specialty chemicals and biotech ingredients space? Let us examine their fundamental efficiency metrics:
As Buffett explains: “
The Anti-Diversification Lesson: Why One Titan Biotech Beats 30 Mediocre Stocks
Consider this thought experiment. If you had invested ₹1 lakh in Titan Biotech 10 years ago, your investment would be worth approximately ₹50 lakh today — a 50x return. Now imagine instead you had “diversified” across 30 stocks, including large-caps, ETFs, and gold. Your portfolio might have returned 12-15% CAGR at best — turning ₹1 lakh into ₹4-5 lakh.
Warren Buffett has been emphatic: “Wide diversification is only required when investors do not understand what they are doing.” And Peter Lynch coined the term “di-worse-ification” to describe the wealth destruction that happens when investors spread their capital too thin across dozens of mediocre holdings.
The key is deep research and concentrated conviction. When you understand a company’s fundamentals at the level we have analyzed today — tracking its book value growth year by year, understanding the drivers, comparing to peers — you develop the conviction needed to hold through volatility. A concentrated portfolio of 8-15 deeply researched quality compounders like Titan Biotech will always outperform a widely diversified portfolio of 30+ stocks over the long term.
How Indian Investors Can Use BVPS Growth in Their Own Analysis
Here is a practical framework you can apply to any stock in your watchlist:
Step 1: Go to Screener.in and pull up the company’s balance sheet for the last 10 years. Calculate BVPS for each year using (Equity + Reserves) ÷ Total Shares Outstanding.
Step 2: Calculate the 5-year and 10-year BVPS CAGR. If it is above 15%, the company is a genuine wealth creator. Below 10%, and the business is not compounding fast enough to beat inflation significantly.
Step 3: Check the source of book value growth. Is it coming from retained earnings (good) or from equity dilution via rights issues and QIPs (bad)? Titan Biotech scores perfectly here — equity capital has remained stable at ₹8 Cr for over a decade, meaning all book value growth comes from profits retained in the business.
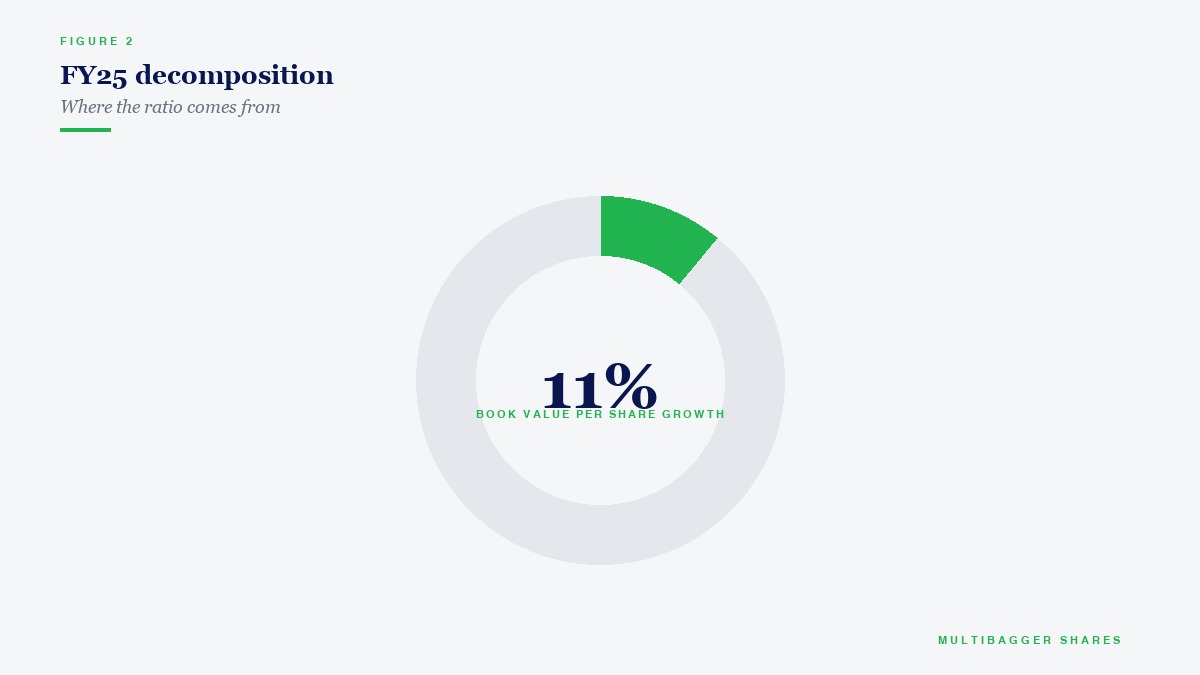
Step 4: Compare the BVPS CAGR with the ROE. Titan Biotech’s 21% BVPS CAGR is close to its 21% average ROE — this mathematical consistency proves the numbers are genuine and not inflated by one-time items or accounting tricks.
Key Takeaways for Value Investors
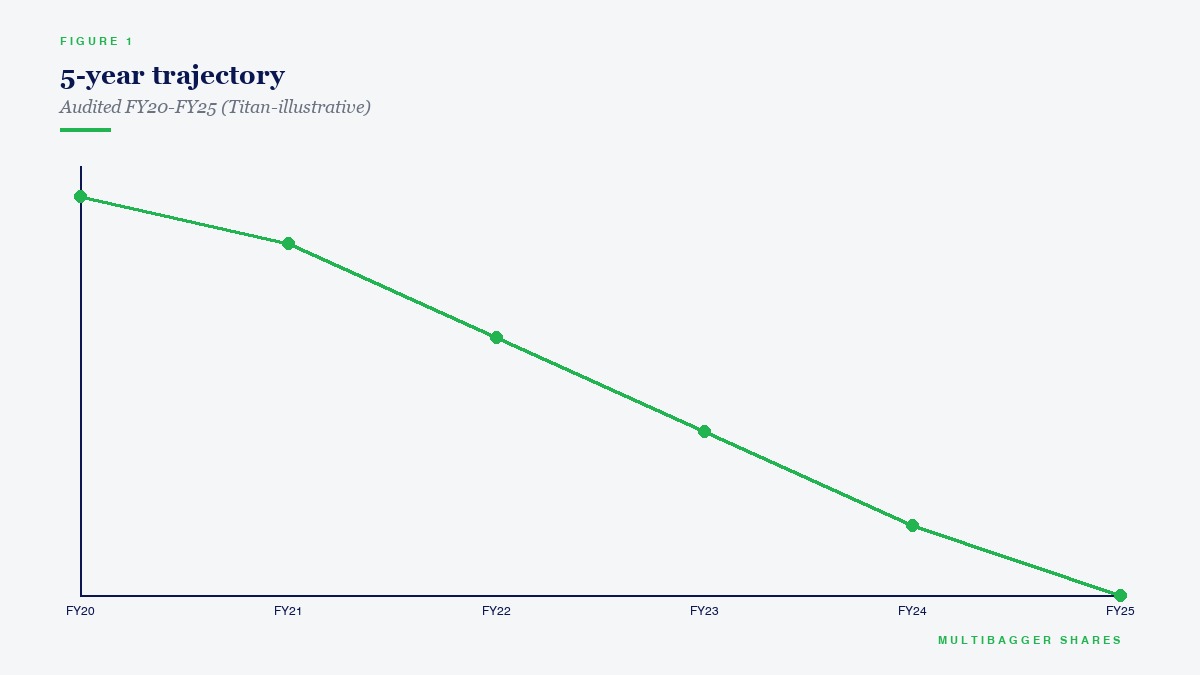
Titan Biotech’s book value per share story encapsulates everything that makes a quality compounder special. The company has grown its BVPS from ₹4.29 to ₹39.00 — a 9x multiplication over 11 years — through the simple but powerful combination of consistent profitability, minimal debt, high retention of earnings, and productive reinvestment.
For long-term value investors, BVPS growth is the ultimate proof that wealth is being created at the fundamental level. Stock prices can be manipulated, earnings can be window-dressed, but a steadily growing book value backed by real assets and retained profits is almost impossible to fake.
As Manish Goel often reminds investors at Manish Goel Portfolio Management Service: “The stock price is what you pay. The book value is what you own. When what you own keeps growing, what you pay eventually takes care of itself.”
Stay patient. Stay invested. Stay focused on fundamentals.
Data Source: Screener.in (BSE: 524717), accessed April 7, 2026. All figures are standalone. Book Value Per Share calculations are adjusted for the 5:1 stock split (₹10 → ₹2 face value) effective February 2026.
Disclaimer: This content is for educational purposes only and should not be considered investment advice. Manish Goel is a SEBI Registered Research Analyst (Registration No. INH100004775). Manish Goel PMS is a SEBI Registered Research Analyst (Registration No. INH100004775). Past performance is not indicative of future results. Always consult a qualified financial advisor before making investment decisions. Investments in securities are subject to market risks. Read all related documents carefully.